The foundation of modern portfolio theory can be clearly dated by the publication of Portfolio Selection by Harry Markowitz (Journal of Finance, March 1952). Prior to Markowitz’ seminal work, finance as a discipline was almost exclusively concerned with security valuation. At the same time, the role of financial advisors was focused on individual stock selection rather than portfolio advice. Modern portfolio theory revolutionized asset management by showing that securities attributes should not be evaluated in isolation but rather as part of a portfolio. In that context, the correlation of a security to the market portfolio is much more relevant than the volatility of that security as a measure of risk contribution. The operational workhorse of modern portfolio theory is mean variance optimization (“MVO”). MVO is a mathematical model that takes expected returns, volatilities and correlations as inputs and produces an optimal asset allocation. MVO is about diversification, up-weighting assets that are idiosyncratic and down-weighting assets that are highly correlated to the market portfolio. Even if not applied in a rigorous way, MVO is a great framework for investors to think about how to allocate their capital in an optimal way.
As our investors know, we make extensive use of MVO across our funds, particularly in our systematic funds. The key to our successful application has been to balance the trade-off between the quantity and the quality of the data we use as inputs. Traditional statistics deal with the estimation of parameters (means, volatilities, correlation) from “stationary distributions.” What stationary means is that while the data changes from day-to-day and sample-to-sample, they are produced by the same “model.” For example, consider simulating draws from a normal distribution with a given mean and variance. Of course, we will see different values for each draw but since they are all outputs from the same model, with enough data we can completely recover the mean and the variance. However, if the model changes, i.e. the mean and the variance change, then more data is not necessarily better. We have found that estimation over a shorter horizon coupled with methods to reduce the noise in the data works much better than using all available data.
The problem of non-stationarity is very acute for long-term investors. For example, a college endowment or a pension plan usually has decades long investment horizons. Even individual investors, when thinking about their retirement, face a multi-decade portfolio allocation problem. MVO can give them a good framework to think about their portfolio, but if they are blind with respect to long-run volatilities and correlations, how are they to invest? Before trying to solve this problem let’s explore in more detail some of the most acute issues that long-term investors face.
Long-Run Correlation
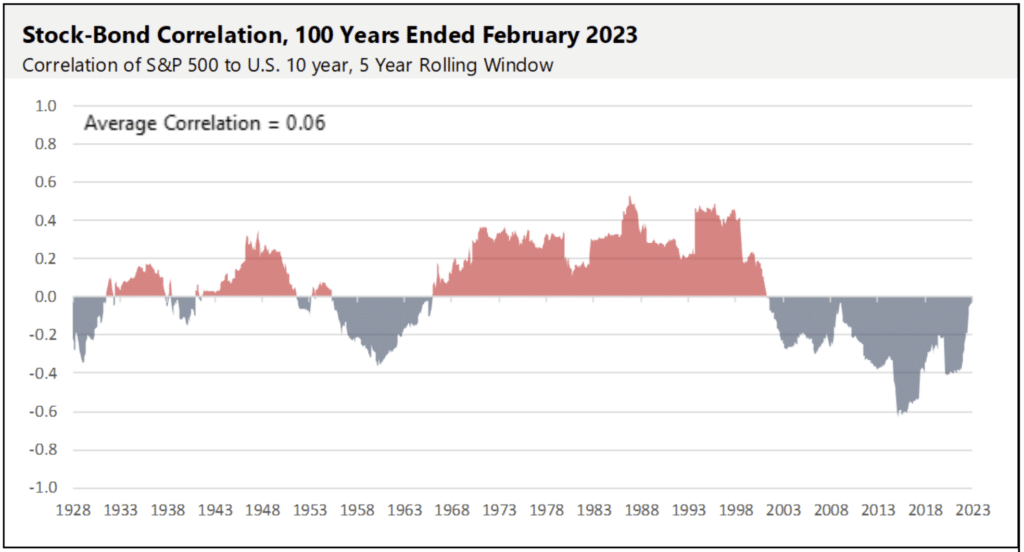
Over the past two decades, the stock-bond correlation has usually been negative and, up until 2022, has been a major boon for investors who own both stocks and bonds. In periods when stocks performed very poorly, gains from bonds usually helped offset equity losses. While investors had become accustomed to this negative stock-bond correlation, historically we can find significant periods when the correlation has been positive. Looking at a long-term time series of the stock-bond correlation, we can observe many interesting patterns:
- The long-run average correlation is slightly positive, contrary to the common belief that the correlation is negative.
- Even though the average long-term correlation is close to zero, actual correlation values are rarely at zero.
- Actual correlation values tend to fall into strong positive or strong negative regimes, which are typically multi-year or decades long.
- From our knowledge of financial and macro history, we can associate periods of positive correlation with periods of high inflation and/or active monetary policy, while periods of negative correlation exist mostly when growth shocks dominate and monetary policy is very accommodative.
This asymmetry means the very negative stock-bond correlation of the last twenty years might be less helpful over the next twenty years.
Long-Run Volatility
Proponents of “stocks for the long run” advocate that long-term investors should allocate a large portion of their holdings to stocks. This is critically based on the observation that over long horizons, stocks exhibit negative autocorrelation. Good times, when stocks perform very well, are followed by periods of high volatility, during which stocks face severe corrections to then become cheap and once again re-take their long-run upward trend. This is a story of mean reversion which mathematically translates into the fact that long-run stock volatility is lower than short-run stock volatility. We know that in MVO, the allocation to any asset is inversely related to its volatility, which in this case means that long-run investors should have a higher allocation to equities than short-run investors. This is the argument behind the common financial advice that younger people should almost exclusively hold equities in their portfolios. This pattern is borne by the data and it is out of debate. However, Lubos Pastor (University of Chicago) and Robert Stambaugh (University of Pennsylvania)1 challenged the validity of this fact for portfolio allocations. Their point is a bit technical but easy to grasp. When we measure volatility by taking the standard deviation of past returns, we fix the mean at the realized sample value. However, when we look forward, we really do not know what the mean return will be, so the uncertainty going forward is much larger than the “measured” uncertainty. Said another way, as we try to forecast long-run future volatility, we need to incorporate the uncertainty about the mean return and when we do that, it more than offsets the positive effect of mean reversion. In their view and calculations, stocks are much riskier for long-run investors, and they recommend a lower allocation to stocks.
Considerations for Investors
Overall, the property of non-stationarity for returns poses several significant challenges for investors, especially at long time horizons. One way for investors to mitigate this problem is to add active management to their portfolios. Active management can help alleviate some of these problems by shortening the horizon and hence reducing the uncertainty around the data. Adjusting the portfolio to respond to changing market conditions requires constant monitoring of market trends and making investment decisions based on real-time data. This can be time-consuming, resource-intensive, and requires a deep understanding of the market dynamics at play.
In the end, no single asset class or strategy performs well all the time, and holding diversifying alternatives as a long-term, strategic allocation in an investment portfolio offers the potential for significant benefits over time. Many investors understand the importance of diversification in building a portfolio that is resilient to various market conditions. Nonetheless, in the decade preceding the global disruptions of 2022, fear of missing out on the seemingly persistent growth of the 60/40 portfolio left many investors without sufficient diversification (right before it was needed most). As 2022 taught us, building a portfolio that is able to consistently meet investment objectives requires investors to look beyond returns and consider a range of factors including investment horizon, volatility, diversification and correlation characteristics, and liquidity, among other factors.
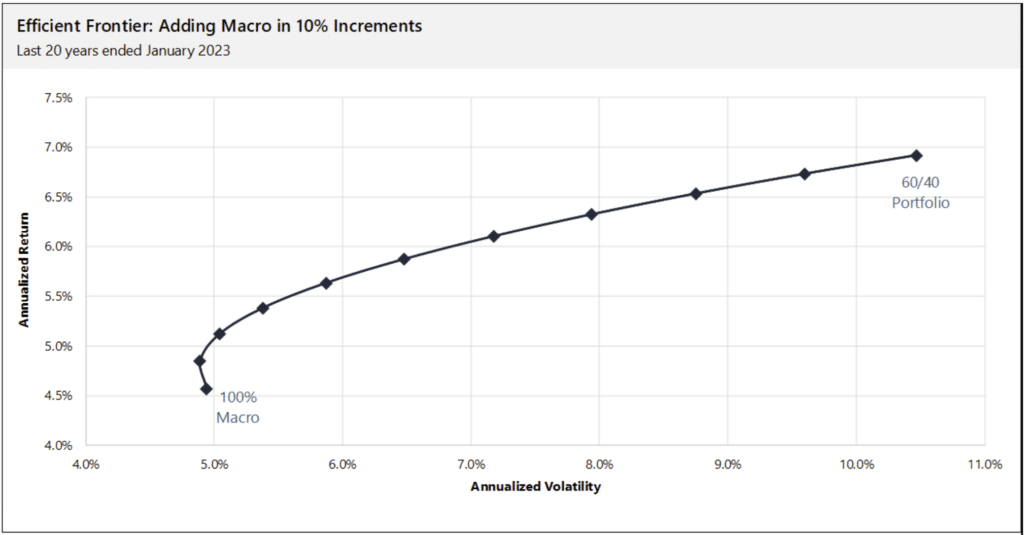
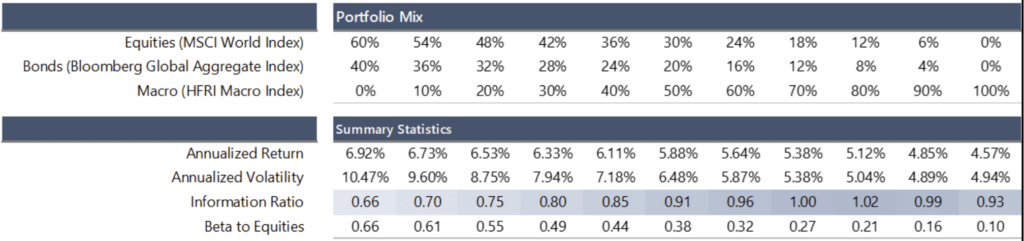
As a trading style, macro has demonstrated through many market cycles that it has the capability to produce compelling returns during periods of market stress while also producing acceptable returns during market cycles that are favorable to the 60/40 portfolio. The best macro funds can have low correlation to equities in normal times and strong negative correlation when equities are under significant downward pressure. This characteristic is of great value to diversification and long-run performance as demonstrated by the following chart. The benefit of adding macro is evident by the significant increase in the Sharpe ratio to a stylized portfolio.
PERFORMANCE DISCLOSURE
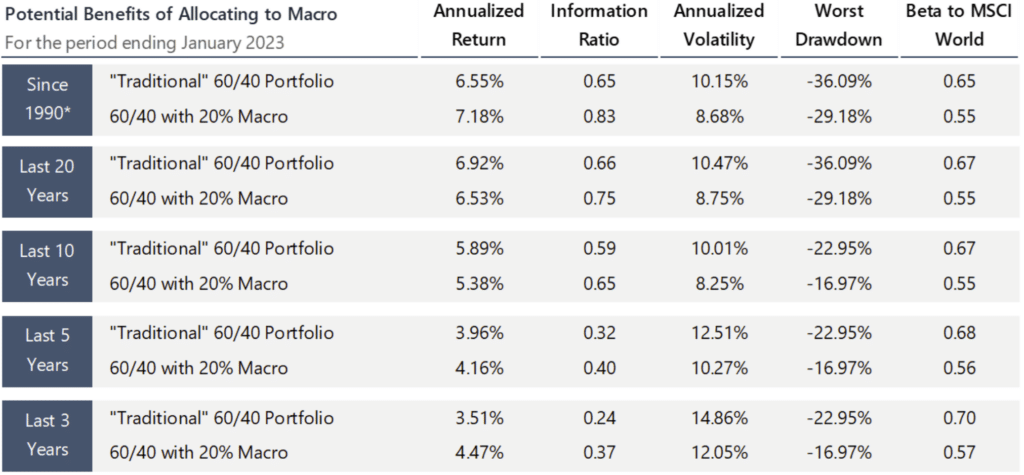
Traditional 60/40 Portfolio: Reflects a portfolio with a 60% allocation to equities and a 40% allocation to bonds as represented by the MSCI World Index and the Bloomberg Global Aggregate Index, respectively, rebalanced monthly.
60/40 with 20% Macro: Reflects a portfolio with a 48% allocation to equities, 32% allocation to bonds, and 20% allocation to macro, as represented by the MSCI World Index, Bloomberg Global Aggregate Index, and the HFRI Macro (Total) Index, respectively, rebalanced monthly.
PAST PERFORMANCE IS NOT NECESSARILY INDICATIVE OF FUTURE RESULTS.
INDEX DISCLOSURE
The below are widely used indices that have been selected for comparison purposes only. Indices are unmanaged, and one cannot invest directly in an index. Except for HFR indices, which do reflect fees and expenses, the indices do not reflect any fees, expenses or sales charges. Unlike most asset class indices, hedge fund indices included in this presentation have limitations, which should be considered in connection with their use in this presentation. These limitations include survivorship bias (the returns of the indices may not be representative of all the hedge funds in the universe because of the tendency of lower performing funds to leave the index); heterogeneity (not all hedge funds are alike or comparable to one another, and the index may not accurately reflect the performance of a described style); and limited data (many hedge funds do not report to indices, and the index may omit funds which could significantly affect the performance shown; these indices are based on information self-reported by hedge fund managers which may decide at any time whether or not they want to continue to provide information to the index). These indices may not be complete or accurate representations of the hedge fund universe, and may be affected by the biases described above.
BLOOMBERG GLOBAL BOND INDEX:
The Bloomberg Global Aggregate Bond Index is a broad-based market capitalization weighted measure of the global investment grade fixed-rate debt markets. This multi-currency benchmark includes treasury, government-related, corporate and securitized fixed-rate bonds from both developed and emerging markets issuers. There are four regional aggregate benchmarks that largely comprise the Global Aggregate Index: The US Aggregate, the Pan-European Aggregate, the Asian-Pacific Aggregate and the Canadian Aggregate Indices. The Global Aggregate Index also includes Eurodollar, Euro-Yen, and 144A Index-eligible securities, and debt from five local currency markets not tracked by the regional aggregate benchmarks (CLP, MXN, ZAR, ILS and TRY).
HFRI MACRO INDEX:
The HFRI Macro Index is a sub-index of the HFRI Fund Weighted Composite Index and is composite index of over 900 Investment Managers which trade a broad range of strategies in which the investment process is predicated on movements in underlying economic variables and the impact these have on equity, fixed income, hard currency and commodity markets.
MSCI WORLD INDEX:
A market cap weighted stock market index of 1,652 global stocks and is used as a common benchmark for ‘world’ or ‘global’ stock funds. The index includes a collection of stocks of all the developed markets in the world, as defined by MSCI. The index includes securities from 23 countries but excludes stocks from emerging and frontier economies.
