The Federal Reserve at its last meeting raised rates to the 5.25%-5.50% target range for a cumulative total tightening of 525 basis points for the current hiking cycle. This is the largest and fastest hiking cycle since Volcker’s by a large margin and has pushed real rates, in particular short end real rates, to levels not seen since the early 2000s.
Markets are currently pricing almost even odds of just one more hike and then, after a brief pause, the current pricing implies that the Fed will start cutting at a moderate pace. I think it is fair to say that whether the Fed hikes once, or even twice from here, we are very near the end of the tightening cycle.
Market Implied Rates (U.S.)
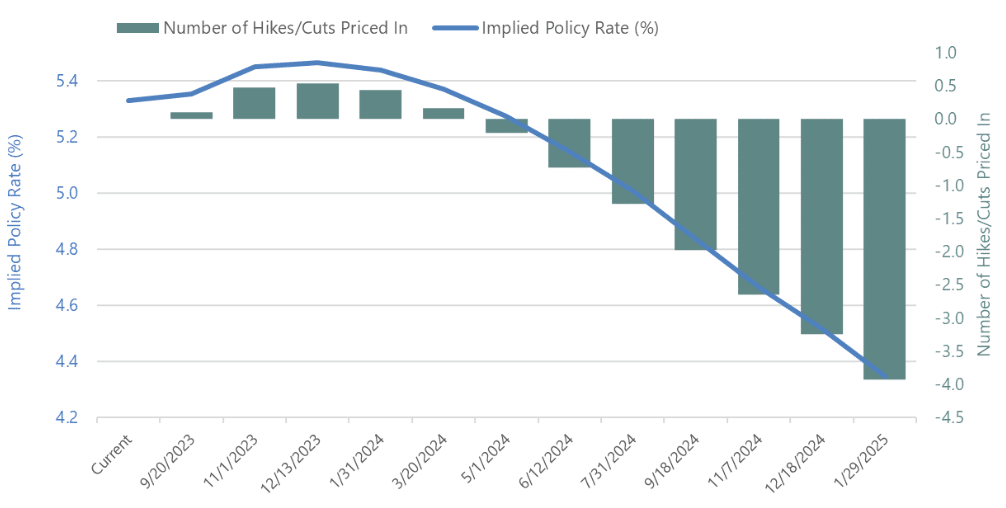
What is not clear and what is keeping rates markets active is the path to the first cut. Inflation data has significantly moderated but it is still running well above the 2% target. In particular, the supercore measure that the Fed has focused on is well above 2%. Also, the labor market has continued to show incredible strength. As our macroeconomic team pointed out in “FOMC Outlook: From High to How Long”, it is unprecedented for the Fed to cut with such a strong labor market, with the most likely outcome being a prolonged period of rates at current levels. Looking at the last four hiking cycles it took the Fed 5, 8, 15 and 7 months, respectively, to cut after the last hike (9 months on average), so even 12 months, which is well beyond current market’s expectation, would be completely plausible.
Given these dynamics, what can we expect for markets in the coming months? Lessons from historical Fed cycles are very interesting and we can draw inferences from these periods. One pattern that we have highlighted in previous works is the uncertainty surrounding the end of cycle period. Notably, when reading statements from the meetings that ended each hiking cycle, it shows a Fed that was still in hiking mode at those meetings. It is almost as though the lags of policy caught the Fed by surprise, slowing the economy faster than expected, and subsequently leading the Fed to de-facto stop hiking at all once. Hence, each hiking cycle concluded without any formal announcement or even a hint of one.
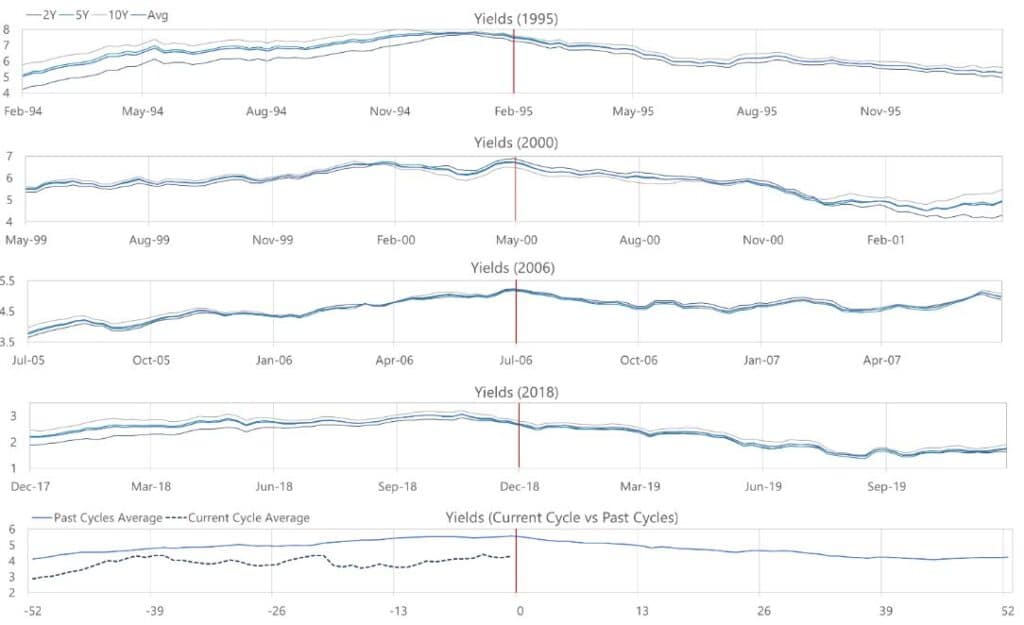
To deepen the understanding of end-of-cycle dynamics, we looked at the behavior of the yield curve in all of these episodes. In the spirit of factor models, we characterize the yield curve by level, slope and curvature and look at the dynamics of these three variables for the year before and the year after the last hike. It is well known that these three factors capture 99% of the variation in yields, so by focusing on them we can capture all the relevant macro dynamics while getting rid of idiosyncratic moves. We construct factors not as PCAs but rather using market convention: level is then the average of all yields, slope is the 2s-10s spread and curve is 2y-5y-10y fly.
From a rates perspective, 1994/1995, when Greenspan’s Fed hiked rates from 3% to 6%, was as interesting as it can get: in fact, this period was characterized as “The Great Bond Massacre”. It is not really fair to attribute all of the turmoil to the Fed as rates globally went up significantly (JGBs in fact preceded the selloff in Treasuries). However, the Fed hike of March 1993 and subsequent aggressive hiking caught the market by surprise and created a bond carnage with long-term rates moving up 300bps in a very short period. The behavior of average yields for all other cycles were a lot more muted than in 1994, but they all show an identical pattern of yields moving up right up to the point of the last hike and declining by about the same amount in the year following. It is important to notice that we are looking at the average of longer dated rates. Of course, Fed Funds will, by definition, peak around the last hike and then decrease as the Fed is cutting but longer-dated bonds should, in theory, incorporate this information and peak well before the last hike. Hence, what this pattern shows is that the market typically prices a risk of higher yields as long as the Fed is tightening and then gradually removes this “premia” after the Fed ends its hiking cycle.
Yields Pre- and Post- Last Fed Hike
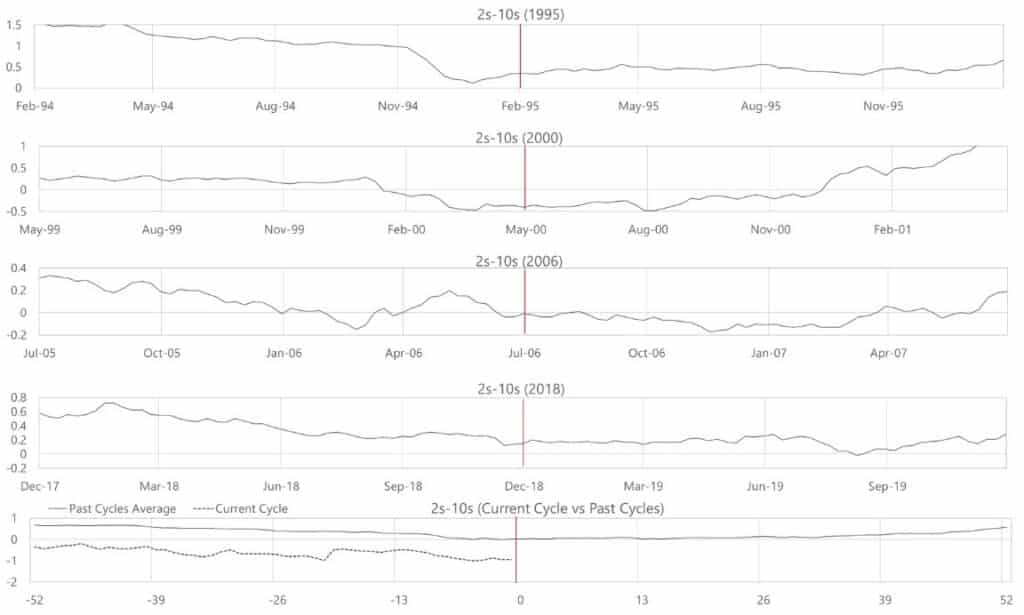
A more nuanced dimension is that of the slope, in our case represented by the 2s-10s spread. There are four basic moves that the slope can go through: bear steepening, when long rates go up more than short rates; bull steepening, when short rates go down more than long rates; bear flattening, when short rates go up more than long rates and finally bull flattening when long rates go down more than short rates. Not all these scenarios have the same likelihood. In fact, bear flattening and bull steepening are much more likely and almost always Fed driven. As the Fed tightens policy, it drives down expectation of future growth and inflation. Hence, long rates do not go up as much as short rates, which are exclusively driven by the Fed, and the curve bear-flattens. Conversely, when the Fed cuts rates, it boost expectations of future growth and inflation and hence long rates do not go down as much as short rates and the curve bull-steepens. Looking at the data, we can see that the slope has a very clear pattern of bear flattening, even inverting, as the Fed tightens and subsequently bull steepens back to its previous value. However, while most of the level correction happens right after the Fed stops hiking, the slope takes time to get back to previous levels and really moves back to a normal steeper curve when the Fed starts cutting (some 9 months after the last hike). For this cycle, the curve inverted very early on, around July 2022, and reached extreme levels of inversion with a current level of -75 basis points. Historically, the curve has been a strong predictor of recession and statistically levels like this are very strongly associated with an ensuing recession.
Slope Pre- and Post- Last Fed Hike
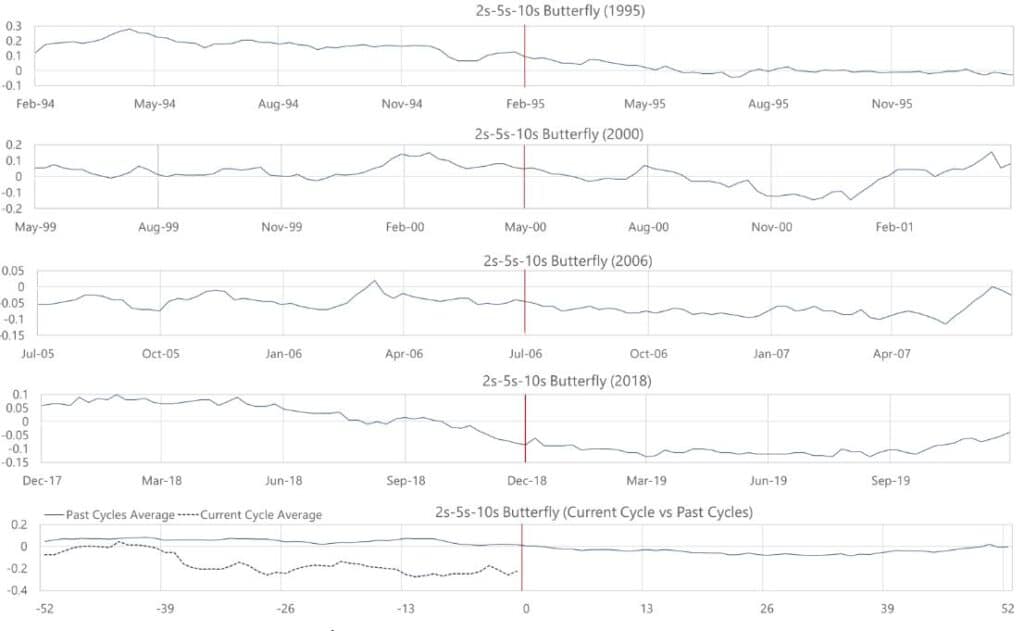
The next relevant factor is how “curvy” the yield curve gets pre- and post- the last hike. While level and slope show a very clear pattern, the curve behavior is not so clear cut. What we would expect is that steep curves, when the slope is very high, correspond to very concave, curvy trades. The reason for this has to do with arbitrage considerations, mostly how in upward sloping curves one should favor being long 2s-10s vs the belly, and in flat to inverted curves one should favor being long the belly and short the wings. This creates selling pressure on the belly in steep curves and buying pressure on the belly in flat curves hence making steep curves much more concave (“curvy”). In an ECB working paper (Level, Slope, Curvature of the Sovereign Yield Curve and Fiscal Behaviour, Afonso and Martins, December 2010) the authors link the magnitude of fiscal deficits to the curvature. They find fairly conclusive evidence that large fiscal shocks put pressure on the belly and creates a strong concavity in the curve. When looking at the data, it does look like the curve becomes more concave a year after the last hike when the slope picks up steam as well; however, the evidence is not as conclusive as for level and slope. However, if one adds the current fiscal dynamics of ever growing fiscal deficits, then it feels live as rates come down and the slope normalizes, the curve can go to a much more concave shape.
Curve Pre- and Post- Last Fed Hike
As for equities, they have posted positive returns in all but one cycle in the year following the last hike. On average, equities rallied 20% for that period but there is a large dispersion. For example, after the Fed stopped in May 2000, equities dropped by almost 30% driven particularly by the collapse of tech (internet) shares. However, one should expect that as the Fed stops and yields fall, equities should find a favorable environment.
One last thing to consider is that as we go into late 2024, the period when we expect the Fed to start cutting, we will bump into the presidential election. Will this prevent the Fed from cutting aggressively if we were to go into recession? It is early to know but it is important to keep this in mind.
These historical patterns give us a road map of what is likely to happen in the coming months. However, they are just that, a road map that can help us to predict what is likely to happen. Global macro, at its best, is tactical and can dynamically adjust to changing markets situations rather than taking a sticky long-term position. As such, while we use all this information when we consider how to position our views, we also use many other variables to optimize our information ratio.
DISCLOSURE
This presentation includes statements that may constitute forward-looking statements. These statements may be identified by words such as “expects,” “looks forward to,” “anticipates,” “intends,” “plans,” “believes,” “seeks,” “estimates,” “will,” “project” or words of similar meaning. In addition, our representatives may from time to time make oral forward-looking statements. Such statements are based on the current expectations and certain assumptions of Graham Capital Management’s (“GCM”) management, and are, therefore, subject to certain risks and uncertainties. A variety of factors, many of which are beyond GCM’s control, affect the operations, performance, business strategy and results of the accounts that it manages and could cause the actual results, performance or achievements of such accounts to be materially different from any future results, performance or achievements that may be expressed or implied by such forward-looking statements or anticipated on the basis of historical trends.
This document is not a private offering memorandum and does not constitute an offer to sell, nor is it a solicitation of an offer to buy, any security. The views expressed herein are exclusively those of the authors and do not necessarily represent the views of Graham Capital Management. The information contained herein is not intended to provide accounting, legal, or tax advice and should not be relied on for investment decision making.
Tables, charts and commentary contained in this document have been prepared on a best efforts basis by Graham using sources it believes to be reliable although it does not guarantee the accuracy of the information on account of possible errors or omissions in the constituent data or calculations. No part of this document may be divulged to any other person, distributed, resold and/or reproduced without the prior written permission of GCM.
