Interest rate markets have been roiled by massive shocks during the last two years, starting with the significant move upwards in inflation at the end of 2021 during a then-dovish Fed, to the hawkish U-turn by Powell at Jackson Hole 2022, then to the fallout from the SVB collapse and culminating now with a drastic dovish move by the Fed in their December FOMC meeting.
Reacting to this turmoil in fundamentals and sentiment, interest rate volatility has more than doubled from the very low levels achieved during the 2010-2021 decade of easy money and low volatility. Currently, the MOVE index, the main barometer of interest rate volatility, stands at around 120 basis points which contrasts with an average of approximately 65 basis points for the 2010-2020 decade and just 61 basis points for calendar year 2021.
It is also important to point out that most other asset classes are anchored to and strongly influenced by interest rates so this massive volatility is impacting many other sectors as well.
To navigate these markets and turn volatility into an advantage that we can profit from, portfolio managers must possess a deep understanding of all the aspects affecting bond markets. Having a solid knowledge of the dynamics of growth and inflation is crucial. However, there is another very important factor affecting bond prices which is much more complex and more challenging to forecast than the fundamentals: the Term Premium (TP). Simply defined, TP is an extra compensation for duration risk. From a trading standpoint, a low (lower than average) term premium is a strong signal that favors curve steepening trades and vice-versa. As we will see, at times the TP can be the most important factor behind moves in interest rates but also the most difficult one to forecast and pin down. The key problem is that unlike inflation or growth, which we can observe and measure, the term premium can only be estimated using models.
Even though the term premium cannot be measured with certainty, it has undoubtedly risen over the past several years and contributed to bond market volatility. Prior to the pandemic, the term premium was estimated to be zero, a period of very muted bond market volatility and very strong returns for equities. With term premium and bond market volatility on the rise in recent years, this factor has become increasingly important in understanding market performance and has also underscored the importance of tactical trading strategies that can adapt to different market environments.
Many market participants have shown a renewed interest in understanding the role that TP could be playing. Fed and ECB officials have actively spoken about the term premium and its impact on the transmission of monetary policy. The financial press has also been very focused on it, with the Wall Street Journal for example running a story about the term premium in Treasuries under the title “Wall Street’s Latest Obsession Is an Unknowable Number” in mid-October. In order to excel at trading macro, one needs to try to understand how to forecast all factors driving markets and TP is an important one.
A Framework for Measuring the Term Premium
In economic theory, the yield of a long-term bond is the sum of the expected path of the risk-free interest rate plus the term premium. The expected interest rate path is the market assessment of what the policy rate will be from today to the expiration of the bond while the term premium is the extra compensation that investors require for bearing duration risk. From this definition, it is immediately evident how difficult it is to measure the term premium. Neither the expected policy path nor the term premium can be observed so we need models to estimate them.
It is well-understood that the key factors driving the yield curve and its volatility are those fundamental factors that enter the Fed’s monetary policy function. Growth and inflation are of course the main drivers of yields as they are also the main drivers of monetary policy. For example, under the Taylor rule, the policy rate is completely determined by the long run real rate (R Star) plus the deviation of inflation and output from the target level. Even if the Fed is not rigidly following a mathematical rule, like the Taylor rule, they are still going to set monetary policy very heavily within this framework and hence forward-looking investors will price the yield curve according to this framework as well.
However, bonds are volatile assets, and, like equities, they command an extra compensation for their risk. In the case of equities, the compensation is the equity risk premium (ERP), i.e. the expected excess return of equities over the short-term risk-free interest rate. The rationale behind the ERP is obvious: equites massively underperform in recessions, a time when investors are more risk averse and hence there needs to be an incentive, a positive ERP, to induce investors to buy equities. In the case of bonds, we call the extra compensation the term premium, but the concept is less straightforward. I find the most useful way to think about the TP is from the standpoint of the Capital Asset Pricing Model. In this paradigm, assets that are positively correlated to equities will command a positive premium while assets that have negative correlation command a negative premium. The key is what is meant by correlation: here, we are referring to the forward-looking expected correlation between stocks and bonds and in particular the correlation at crisis times, i.e. the conditional stock-bond correlation. If bonds are expected to be positively correlated to stocks, like they were between 1960 and the end of the 1990s, then it is likely that the TP will be positive as in this case bonds are like stocks. However, if the expected correlation is negative then one could expect a very low and even negative TP (for more on stock bond correlation, please see Macroeconomic Drivers of the Bond-Stock Correlation, Calderini and Skilton, August 2021).
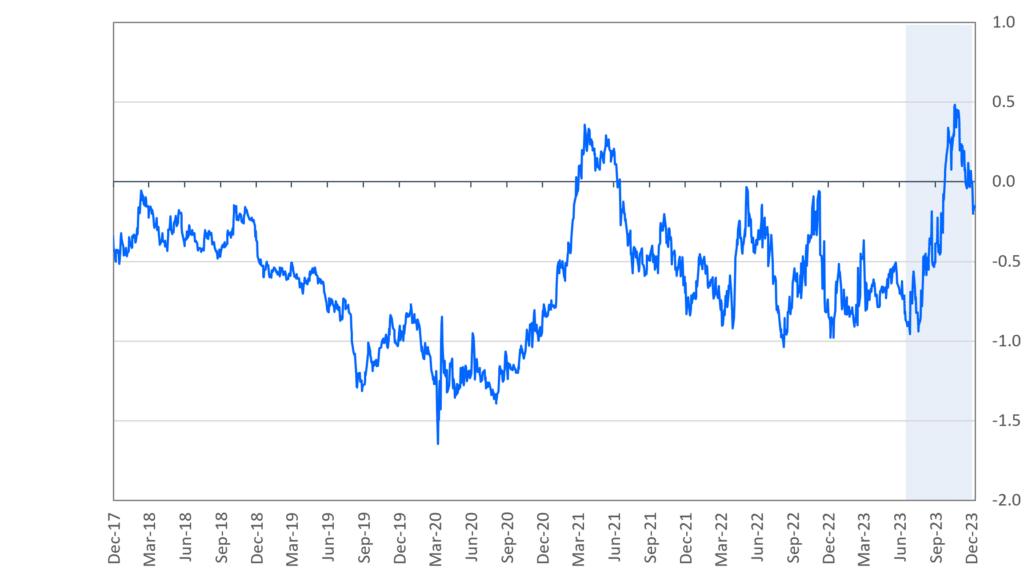
The most well-known and accepted model for the TP is the ACM model (Bloomberg ticker ACMTP10 Index for the U.S. 10yr). It is a five-factor model, with the usual PC1 (level), PC2 (slope) and PC3 (curve), augmented by two extra factors. The graph for this ACMTP shows that the term premium can be very volatile and has been a significant contributor to the movements in yields.
As can be seen from the graph below, the TP according to the ACM has spent a considerable amount of time in negative territory during the last several years. However, we can also see the large move that started in July of this year. If the ACM model is correct, nearly all the moves in yields from July to mid-October, and the subsequent bond rally, can be explained by changes in the TP rather than changes in fundamentals.
U.S. 10yr Treasury Term Premia Estimates (ACMTP10)
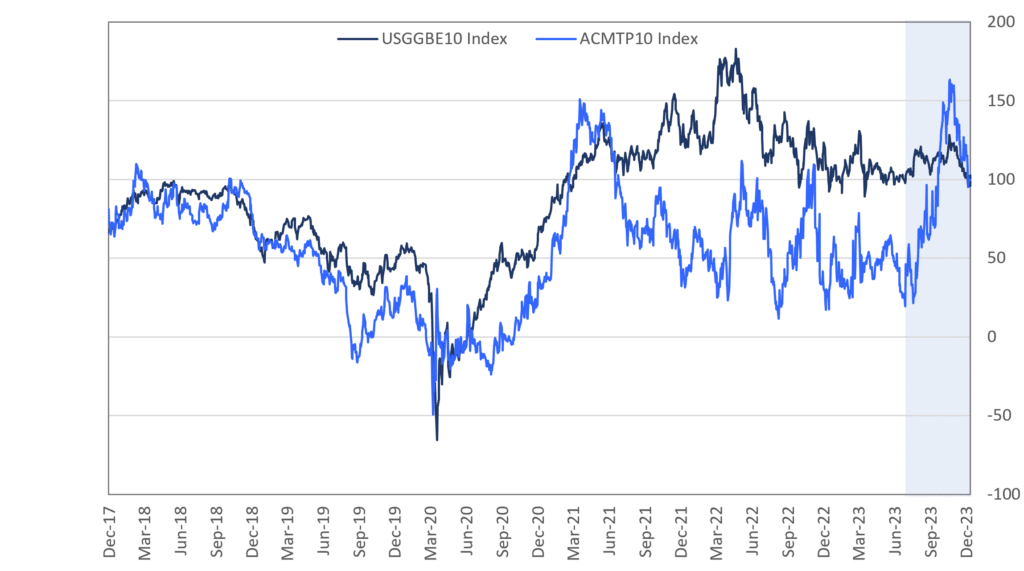
It is also interesting to compare and contrast the large move in the ACMTP back in 2020 with the current one. As we can see from the second graph (below), the move in 2020 seems to be driven by the massive move in inflation expectations that preceded the Fed tightening cycle. One can argue that this move in term premia was mostly if not all caused by concerns about inflation and the potential for a massive tightening campaign (now we know those concerns proved right). However, we can also see that this year, inflation expectations have been completely stable so the move in the ACMTP must be driven by something else. I believe that the main reason behind the move is the concern about fiscal deficits and the massive expected future bond issuance.
U.S. 10yr Treasury Term Premia Estimates (ACMTP10) vs U.S. Breakeven 10yr (USGGBE10)
Normalized to 100 as of Dec-11-2023
A full discussion of the inner workings of the ACM or other models of the term premium is beyond the scope of this note but a list of key variables which dynamics can help to understand and forecast the changes in term premium are:
- The slope of the curve and its evolution is a very important factor behind the TP. The slope was the first variable that E. Fama used as a forecaster of the TP and it is still a key components of some TP models. In this line of thought a steep yield curve is a strong predictor that the long end will on average outperform.
- It is interesting that after Fama’s work, a new line of research highlighted that when curvature (either defined by yield curve flies (e.g. 2s-5s-10s) or by 3rd and higher principal component) was included in forecasting models of term premia, the slope became irrelevant. The point here is that curvature drives both slope and term premia and not the other way around. The idea that the concavity or “curviness” of the yield curve can be a strong forecaster of excess returns is very interesting. For example, one might think that it is almost obvious that we need high slope for duration to outperform, however this point says not so. Duration will outperform only when the yield curve has a strong concavity, regardless of the slope. Concave yield curves usually coincide with steep curves so we can confound the true cause, but the key causality is from curviness to TP and not from slope to TP.
- Treasury expected supply can also be a large contributor. Some Fed researchers have argued (see Ferreira and Shousha, 2023) that the supply of treasuries is a major contributor to the term premium, with expected high supply pushing TP upwards. In fact we have seen a significant compression to the TP right after the Treasury announced a refunding schedule that was much smaller and more front loaded than what the markets were expecting. In this line of argument, it is important to follow fiscal and refunding developments very closely.
What is the Outlook for the Term Premium in 2024?
In my previous Outlook (Beyond the Hike: Navigating Market Behavior Pre- and Post-Hiking Cycles, September 2023), we explored the implications of the end of the hiking cycle for the yield curve and other key asset-classes. We saw the curve bear-flattens almost always, even inverts, as the Fed tightens policy and then bull-steepens as the Fed is done hiking. In the last few months, as it has become evident that the Fed is done hiking, we have seen a significant steepening of the curve. However, the curve is still very inverted which I think is related to the fact that Fed Funds are extremely high by historical standards. Regardless, I believe we will see a very significant steepening of 2s-10s during 2024. Importantly, this dynamic is driven by expectation of monetary policy, which is somehow orthogonal to the term premium.
So what about the outlook for the TP?
On top of the expected bull-steepening driven by views of monetary policy, I think we will see a bear-steepening of 2s-10s due to the term premium going up (i.e., 2s-10s becoming steeper due to 10s yields going higher due to an increase in TP.) There are two reasons behind this move. One key development is the increase in correlation between stocks and bonds. We have written extensively about this key variable and how the last twenty years of strong negative correlation should be seen as an anomaly. As explained above, a higher correlation diminishes the hedging properties of bonds and hence increases, all things equal, the term premium. Secondly, the government is back to running high fiscal deficits and, hence, we will continue to see heavy pressure on the long end. The Treasury has managed to calm markets by moving the refunding towards the front-end, but this can only be viewed as a temporary move. Given the fiscal outlook, the notable expected growth in entitlements in particular, Treasury will have to fund more and more in longer maturities, putting extra pressure on the TP.
As we have seen, the term premium stands as a crucial yet intricate factor in decoding the current volatility in bond markets. Amid heightened interest from market participants, unraveling this complexity is essential for understanding monetary policy transmission and anticipating market dynamics in the current macroeconomic environment. Considerations of yield curve slope, curvature, and Treasury supply dynamics are pivotal in influencing the term premium, and hence they should be key factors in the toolkit of macro traders and investors.
DISCLOSURE
This presentation includes statements that may constitute forward-looking statements. These statements may be identified by words such as “expects,” “looks forward to,” “anticipates,” “intends,” “plans,” “believes,” “seeks,” “estimates,” “will,” “project” or words of similar meaning. In addition, our representatives may from time to time make oral forward-looking statements. Such statements are based on the current expectations and certain assumptions of Graham Capital Management’s (“GCM”) management, and are, therefore, subject to certain risks and uncertainties. A variety of factors, many of which are beyond GCM’s control, affect the operations, performance, business strategy and results of the accounts that it manages and could cause the actual results, performance or achievements of such accounts to be materially different from any future results, performance or achievements that may be expressed or implied by such forward-looking statements or anticipated on the basis of historical trends.
This document is not a private offering memorandum and does not constitute an offer to sell, nor is it a solicitation of an offer to buy, any security. The views expressed herein are exclusively those of the authors and do not necessarily represent the views of Graham Capital Management. The information contained herein is not intended to provide accounting, legal, or tax advice and should not be relied on for investment decision making.
Tables, charts and commentary contained in this document have been prepared on a best efforts basis by Graham using sources it believes to be reliable although it does not guarantee the accuracy of the information on account of possible errors or omissions in the constituent data or calculations. No part of this document may be divulged to any other person, distributed, resold and/or reproduced without the prior written permission of GCM.
