Not hawkish enough: What the term structure was telling us
In my remarks about the inflation outlook at the end of last year, I made the observation that the term structure reflected an extremely unlikely path, one where the Fed would never tighten real rates yet inflation was nonetheless projected to come down rapidly and significantly (as priced by inflation swaps or break-evens).
To review the setup at the time, we had 5y5y OIS at around 1.75% (a proxy for the terminal rate, and given that the curve had no hump, it also reflected peak Fed rate) and 5y5y inflation swap at 2.5%, implying a terminal real rate of about -75bps. Maybe more remarkable was the fact that -75bps was the highest level along the term structure of real rates. My point then was: “How could the Fed engineer such a rosy scenario? Could real rates never tighten yet inflation would come down in such a smooth way?” To be fair, one can imagine scenarios where this can happen, but they are extremely unlikely.
Since then, we have had a significant repricing driven both by persistent and accelerating inflation and a significantly more hawkish Fed. In his most recent speech, Chair Powell acknowledged the need to move “expeditiously,” which I believe reads “we are well behind where we need to be.” The market has also undergone a decent amount of repricing, not only driving yields higher but also the yield curve much flatter.
Where will rates go from here?
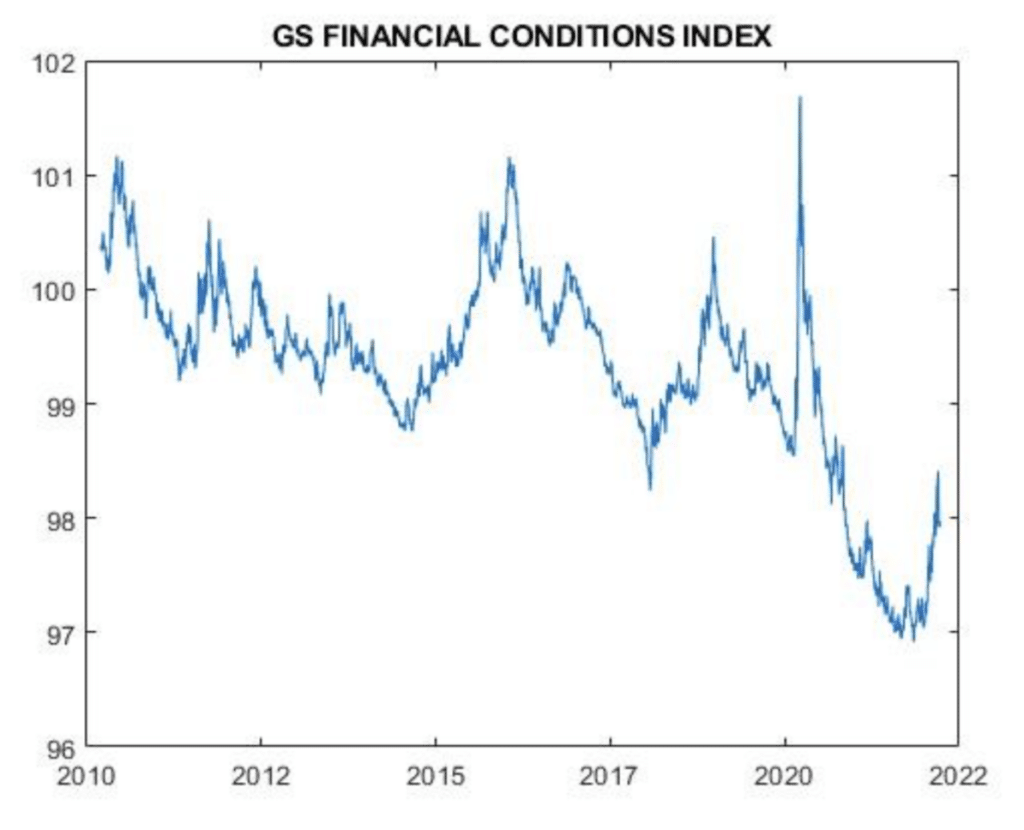
Despite these developments, my view is that we still have much further to go, particularly since we still have significantly negative real rates (and, by the way, much wider break-evens than what we had in December). The GS Financial Condition index tells the story really well:

Even after the recent tick up in this index, we are very close to a decade low, despite inflation, growth and unemployment being much tighter than at most points during this period. My core thinking is that both the markets and the Fed are too optimistic about the Fed’s ability to rein in inflation without significant tightening.
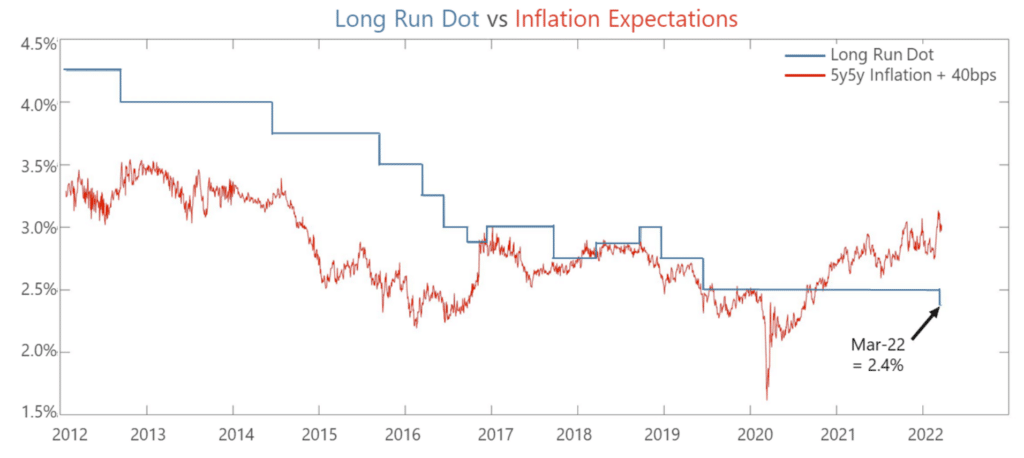
As another example, the current Long Run Dot in March’s Summary of Economic Projections came down to 2.4%. It is interesting to contrast this with the Long Run Dot over the course of the last decade, which tracks very closely with long run inflation:

Thus, despite all its recent hawkishness, the Fed still seems to be in the transitory camp albeit for a longer period. With inflation likely to remain highly elevated, I think that at some point the markets will have to price 2yrs going north of 3% and maybe as high as 3.5%. Curve inversion might be an issue then, but I do not see how inflation could come down significantly unless there is “real” tightening.
One might hypothesize that one of the key drivers of real rates has been quantitative easing and that quantitative tightening (and not rate hikes) is what brings back high real rates. I find this plausible and in fact it might help to tighten policy without curve inversion. However, inflation is so high that in waiting for QT to tighten policy, the Fed might risk un-anchoring inflation expectations.
What happens when real rates increase?
Real rates are the most relevant price signal today. What happens to them will not only determine the pricing of nominal bonds, but most risk assets as well.
My final thought about fixed income goes to TIPS. Overall, one can expect the accrual from inflation to be a strong incentive to include TIPS into any inflation “aware” portfolio and in general as long as the Fed continues to march behind the curve, TIPS should do well both outright and vis-à-vis nominal bonds. However, despite their appeal as an inflation hedge, TIPS – long duration TIPS in particular – might perform quite poorly if real rates were to rise significantly. For example, if long run real rates were to go to 50bps, 10y TIPS will sell off close to 10%, so ironically further inflation pressure could, by triggering a hawkish Fed, be very detrimental for TIPS.
Equities are in a very interesting situation. Normally, one should expect shocks to inflation to be bearish for equities as investors expect the Fed to tighten to rein in inflation (see Macro-Economic Drivers of Stock-Bond Correlation). However, this time inflation is so high, and the Fed is so behind that equities might be one of the few hedges. For example, if we compound the breakeven curve, you get a cumulative 10-year inflation of 45%, while compounding total return for fixed income is just 28%. If you feel that the corporate sector will be able to pass on price increases, equities will then somehow protect you. Clearly, if the Fed were to decidedly tighten policy and were to drive real rates into strong positive territory, equities would perform poorly, and that might be the case later in the tightening cycle. For now, however, equities seem to be one of the few potential hedges to inflation.
Heightened Uncertainty and the Potential for Market Shocks
Having said all that, we need to be aware that markets have moved a lot of late and could face some technical resistance in the short run. Also, given geopolitical developments and massive macro imbalances, there is a significant degree of uncertainty. It is therefore important to see these forecasts as the center of tremendously wide distributions and furthermore, be wary of potential market shocks from either further geopolitical or macro developments.
DISCLOSURE
This presentation includes statements that may constitute forward-looking statements. These statements may be identified by words such as “expects,” “looks forward to,” “anticipates,” “intends,” “plans,” “believes,” “seeks,” “estimates,” “will,” “project” or words of similar meaning. In addition, our representatives may from time to time make oral forward-looking statements. Such statements are based on the current expectations and certain assumptions of Graham Capital Management’s (“GCM”) management, and are, therefore, subject to certain risks and uncertainties. A variety of factors, many of which are beyond GCM’s control, affect the operations, performance, business strategy and results of the accounts that it manages and could cause the actual results, performance or achievements of such accounts to be materially different from any future results, performance or achievements that may be expressed or implied by such forward-looking statements or anticipated on the basis of historical trends.
This document is not a private offering memorandum and does not constitute an offer to sell, nor is it a solicitation of an offer to buy, any security. The views expressed herein are exclusively those of the authors and do not necessarily represent the views of Graham Capital Management. The information contained herein is not intended to provide accounting, legal, or tax advice and should not be relied on for investment decision making.
Tables, charts and commentary contained in this document have been prepared on a best efforts basis by Graham using sources it believes to be reliable although it does not guarantee the accuracy of the information on account of possible errors or omissions in the constituent data or calculations. No part of this document may be divulged to any other person, distributed, resold and/or reproduced without the prior written permission of GCM.

