On May 3rd, when the Fed most recently increased policy rates, the implied OIS rate for June 14th, the next FOMC date, was slightly below the new Fed Fund effective rate. Attributing the small difference to noise, we can fairly say that the market had concluded that May 3rd was the end of the hiking cycle. Since then, and mostly due to a risk-on environment and marginally better data, some probability of a hike has been priced back into the curve but certainly not enough to make it most probable and, more importantly, not enough to force the Fed into hiking. We are still waiting on some important data releases between now and the next FOMC meeting, but as we examine what is priced in now and for the near future, we can conclude that the market is very near an end-of-cycle set up.
So, was May 3rd the last hike? And if it was, what does it imply for markets?
To address the first question, we can go back to previous hiking cycles and analyze statements corresponding to the last hike for each particular cycle. The last hikes for each cycle occurred at: February 1995, May 2000, June 2006, and December 2018.
For example, consider the following three paragraphs:
[February 1, 1995]: “Despite tentative signs of some moderation in growth, economic activity has continued to advance at a substantial pace, while resource utilization has risen further. In these circumstances, the Federal Reserve views these actions as necessary to keep inflation contained, and thereby foster sustainable economic growth.”
[May 16, 2000]: “Against the background of its long-term goals of price stability and sustainable economic growth and of the information already available, the Committee believes the risks are weighted mainly toward conditions that may generate heightened inflation pressures in the foreseeable future.”
[June 29, 2006]: “Although the moderation in the growth of aggregate demand should help to limit inflation pressures over time, the Committee judges that some inflation risks remain. The extent and timing of any additional firming that may be needed to address these risks will depend on the evolution of the outlook for both inflation and economic growth, as implied by incoming information. In any event, the Committee will respond to changes in economic prospects as needed to support the attainment of its objectives.”
One clear lesson from this exercise is that the Fed never called or announced that they were done hiking or even that they were considering a pause. In this context, the realization that these dates marked the last hikes came ex-post, once the Fed went on hold and stayed there for a while. Even more important, not only was there no announcement of a hold but remarkably, in each one of these meetings (perhaps with the exception of 2018), the Fed sounded very hawkish with explicit hiking bias. These paragraphs are great examples of the lags and non-linear nature of the impact of monetary policy. In each cycle, even when the Fed was done hiking, neither the Fed nor financial markets felt it was enough. The Fed indicated on May 3rd that they think they have done enough, meaning they think the policy rate is sufficiently restrictive to achieve their goals; however, there is still important data between now and the June meeting and they are watching the data carefully. So, the current language would be completely consistent with the end of a cycle; however, it does not necessarily imply that.
To address the second question, i.e. the response of financial markets when the hiking cycle is over, we looked at the behavior in each cycle of some key variables after the Fed stopped hiking. Starting with rates, long-term yields fall steadily for the year following the pause:
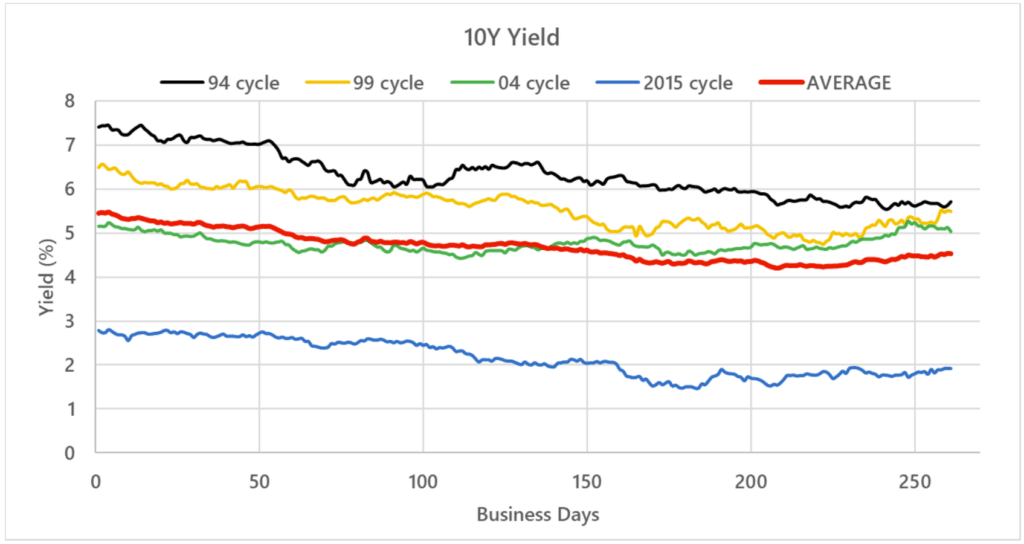
We can observe that in all cycles, yields were lower one year out with an average decline of approximately 100bps. It is important to notice that most of the decrease in yields happened in the first months following the pause when the Fed was firmly on hold and mostly maintaining a hawkish bias.
As yields on 10s were falling, yields on 2s were falling even more rapidly, leading to a big steepening in 2s/10s:
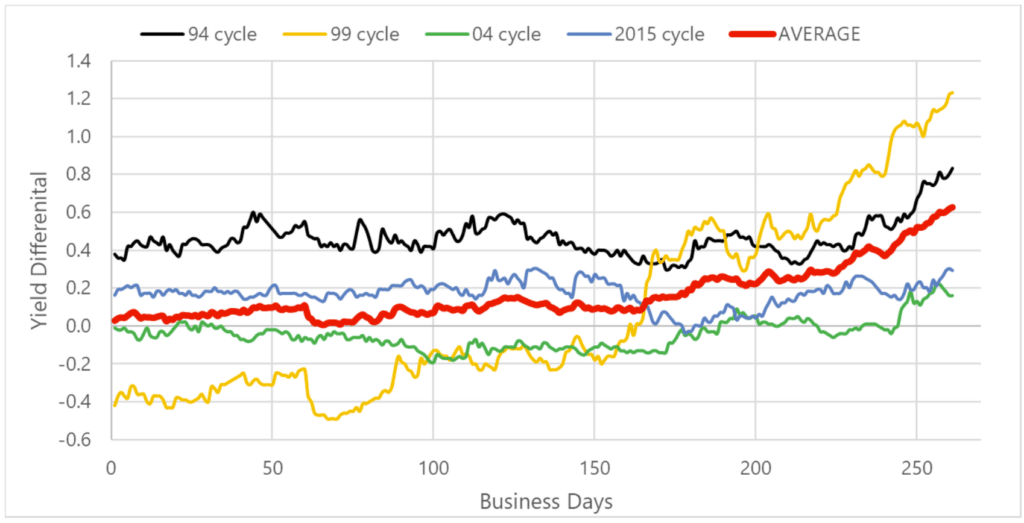
The steepening makes sense when considering that in all instances the curve flattens and even inverts during the hiking cycle. The flattening happens as tighter monetary policy is bringing long-term inflation expectations down so the increase in short rates leads, through expectations of lower future growth and inflation, to lower (at least not higher) long-term yields. When the Fed stops hiking, the curve normalizes as it goes back to the usual upward-sloping shape.
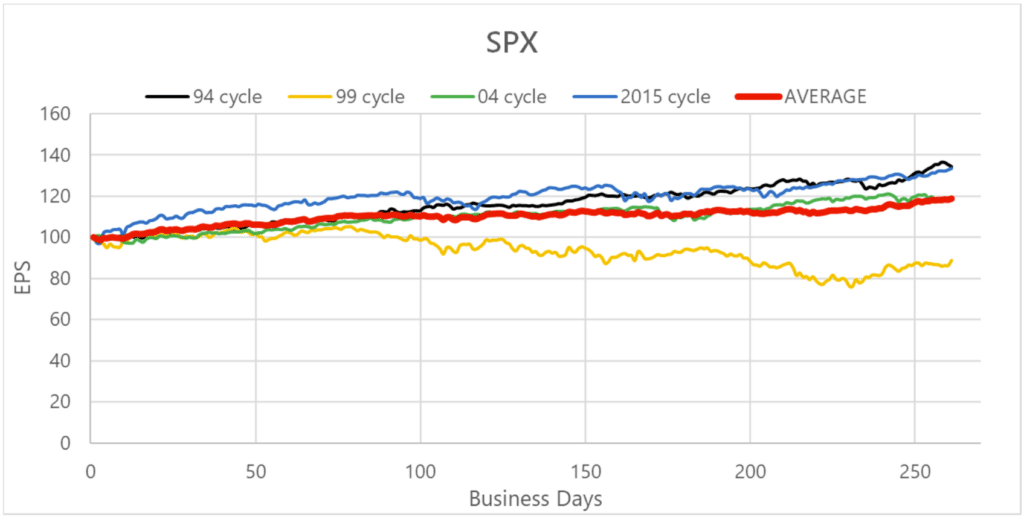
Stocks perform how they are expected to: they recover some ground but at a very moderate pace. Clearly the end of the hiking cycle is a big relief for stocks, but we need to consider that the Fed is stopping because growth is cooling off, sometimes rapidly, and that is negative for earnings:
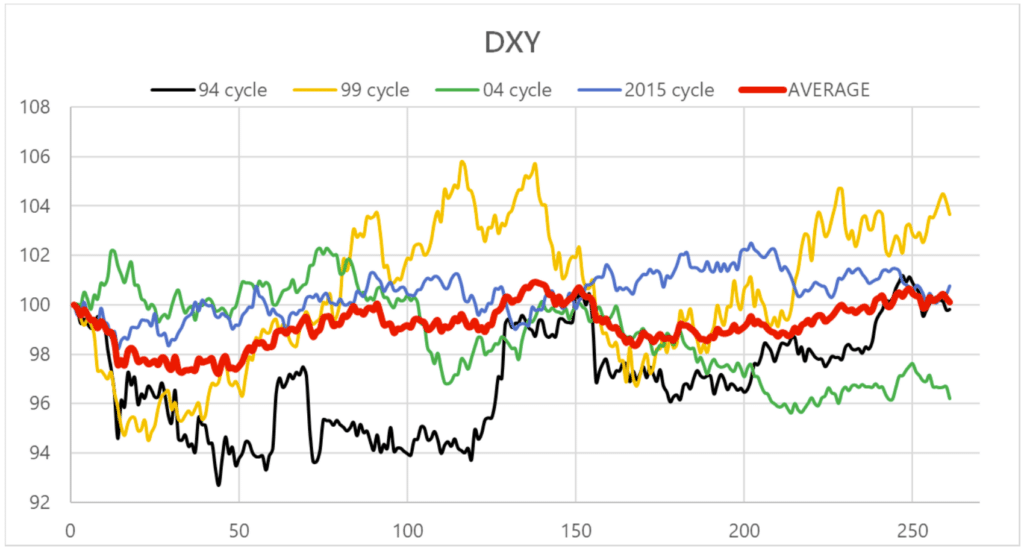
For the U.S. dollar partial equilibrium argument (i.e., thinking about the U.S. side of the equation alone), one would think there has to be a big sell-off on the horizon given the expectation of looser policy and weaker growth. However, there is a high degree of correlation between the largest economies. More importantly, the direction of causality is usually from the U.S. to the rest of the world, meaning a slowdown in the U.S. will negatively impact global growth and will force foreign central banks so stop hiking or even to cut. So, from a general equilibrium perspective, the U.S. dollar should be minimally impacted and this is born by the data:
The way that I process all this information is by breaking it down into three scenarios: In my view, the most likely scenario is that we are indeed at the end of the tightening cycle and that markets will behave very much like they have in the past. At the same time, each cycle was different, and this cycle may be the most dissimilar given the massive inflationary pressures that we are still experiencing. I can think of two tail scenarios that can bring back volatility. One tail scenario would be the case where indeed the Fed has overtightened and with time we will see a massive decline in economic activity and an increase in the unemployment rate. We need to consider that for many years we lived with rates near zero and it is possible that r-star is still very close to zero, so the potential cuts can be significant. The other tail scenario is that we continue to see sticky and persistent inflation. In this case, the Fed will need to hike further. The key consideration with this scenario is that even if the Fed only needs to hike a few more times, current pricing on the curve is implying a few cuts, so risk markets can have an outsized move in this case.
As we said many times, macro trading is all about tactical thinking and sizing bets to the opportunity set that we are facing. In that context, this current phase calls for patience as the best opportunities lie in front of us.
DISCLOSURE
This presentation includes statements that may constitute forward-looking statements. These statements may be identified by words such as “expects,” “looks forward to,” “anticipates,” “intends,” “plans,” “believes,” “seeks,” “estimates,” “will,” “project” or words of similar meaning. In addition, our representatives may from time to time make oral forward-looking statements. Such statements are based on the current expectations and certain assumptions of Graham Capital Management’s (“GCM”) management, and are, therefore, subject to certain risks and uncertainties. A variety of factors, many of which are beyond GCM’s control, affect the operations, performance, business strategy and results of the accounts that it manages and could cause the actual results, performance or achievements of such accounts to be materially different from any future results, performance or achievements that may be expressed or implied by such forward-looking statements or anticipated on the basis of historical trends.
This document is not a private offering memorandum and does not constitute an offer to sell, nor is it a solicitation of an offer to buy, any security. The views expressed herein are exclusively those of the authors and do not necessarily represent the views of Graham Capital Management. The information contained herein is not intended to provide accounting, legal, or tax advice and should not be relied on for investment decision making.
Tables, charts and commentary contained in this document have been prepared on a best efforts basis by Graham using sources it believes to be reliable although it does not guarantee the accuracy of the information on account of possible errors or omissions in the constituent data or calculations. No part of this document may be divulged to any other person, distributed, resold and/or reproduced without the prior written permission of GCM.
