OVERVIEW OF TREND-FOLLOWING
With more than $300 billion in assets under management1, trend-following is one of the largest alternative investment strategies and has become a common allocation in many individual and institutional investment portfolios. Trend-following has historically demonstrated low correlation to traditional investments such as stocks and bonds as well as other alternatives and has the potential to perform well in both rising and falling markets, including equity crisis periods. The strategy is widely regarded as an effective diversifier within an investment portfolio. Here, we outline some of the basic characteristics of trend-following and how it can impact a broader investment portfolio.
WHAT IS TREND-FOLLOWING?
Trend-following strategies use a systematic process, whereby algorithmic models seek to identify price trends in markets, with the expectation that upward trending markets may continue to rally and downward trending markets may continue to decline. These strategies take long positions in positively trending markets and short positions in negatively trending markets, using indicators based on price and volatility of the underlying assets to identify trends of various lengths. Trend followers seek to run diverse portfolios, typically trading liquid, centrally-cleared futures and currency markets, with the number of markets potentially ranging from tens to hundreds. These strategies often target consistent volatility within a predetermined range and try to preserve upside potential and limit downside risk by running with winners and cutting losing positions.
HOW TRENDS ARE IDENTIFIED
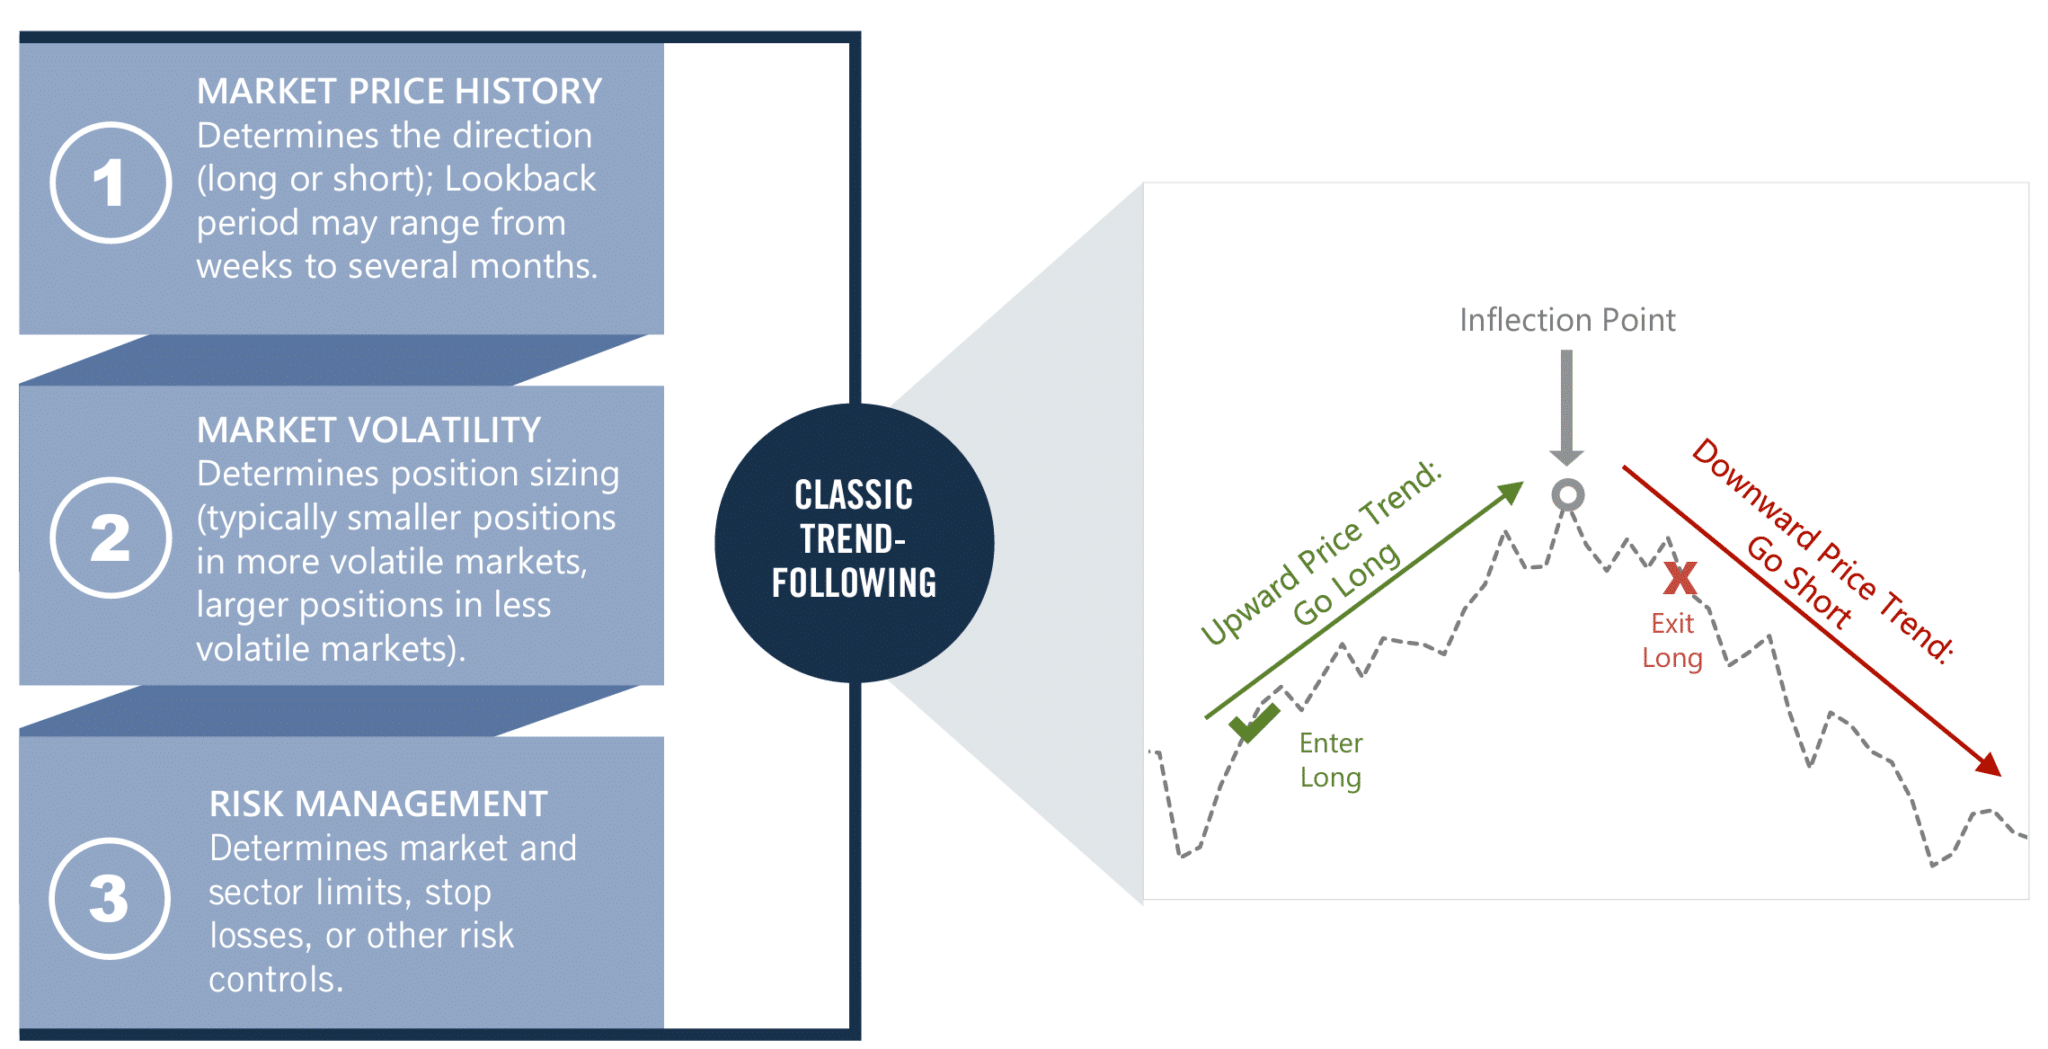
TYPES OF TREND-FOLLOWING MODELS
Moving average and breakout models are two prominent strategies used by most trend-followers for initial signal generation. While these models may be parameterized differently, the raw signals generated are often highly correlated over time because of their common dependence on past prices.
For example, while trend-following models may be parameterized at different speeds, no single speed is optimal over the long-term: if markets are more range-bound, then faster trend-followers tend to perform better as they are better able to capitalize on short-term oscillations in the price. By the opposite argument, in prolonged trends, slower trend-following is advantageous.
Beyond signal generation and trend identification, position sizing and adjustment, risk management, and portfolio construction are important differentiators between trend-following managers.
Examples of Traditional Trend-Following Models
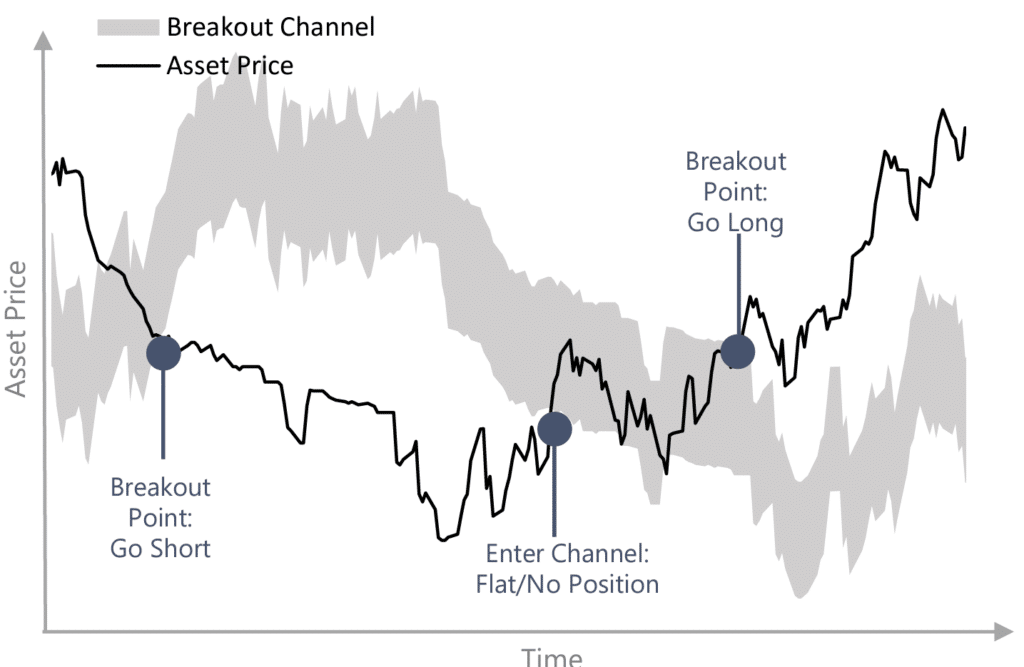
BREAKOUT MODELS
These models compare the current price with a threshold to signal a long, short, or no position. The threshold is determined by either a “price breakout” – a past maximum or minimum price – or a “channel breakout” – a past price at a given lookback and trading range.
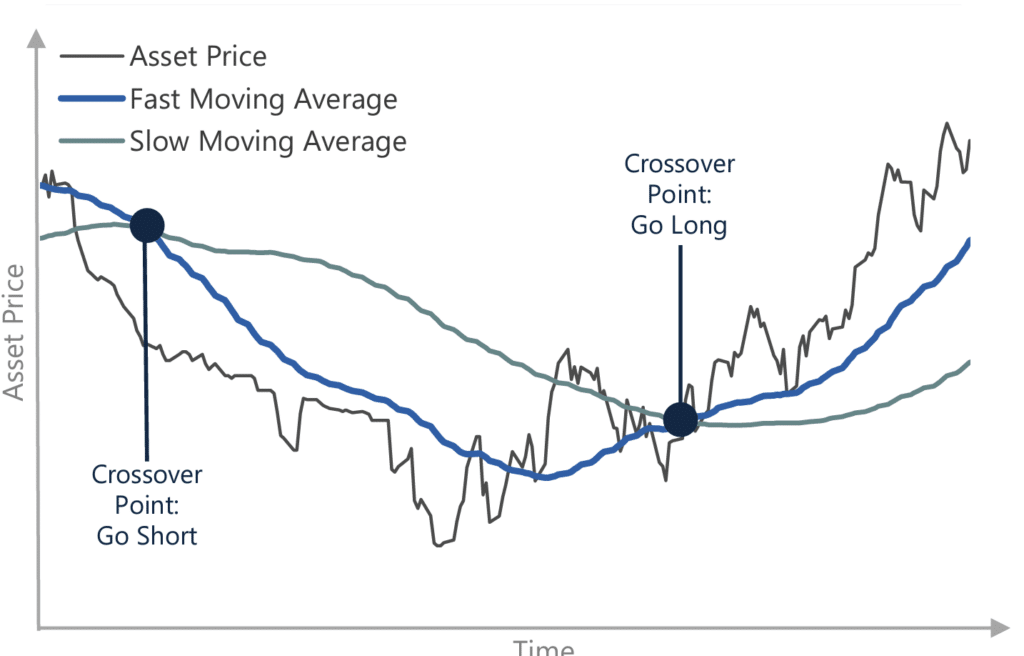
MOVING AVERAGE MODELS
These models use moving averages of past prices to generate a trading signal. The difference between two moving averages, a “fast” and a “slow” one, determines a long or a short position. A crossover between the two will signal a trend reversal.
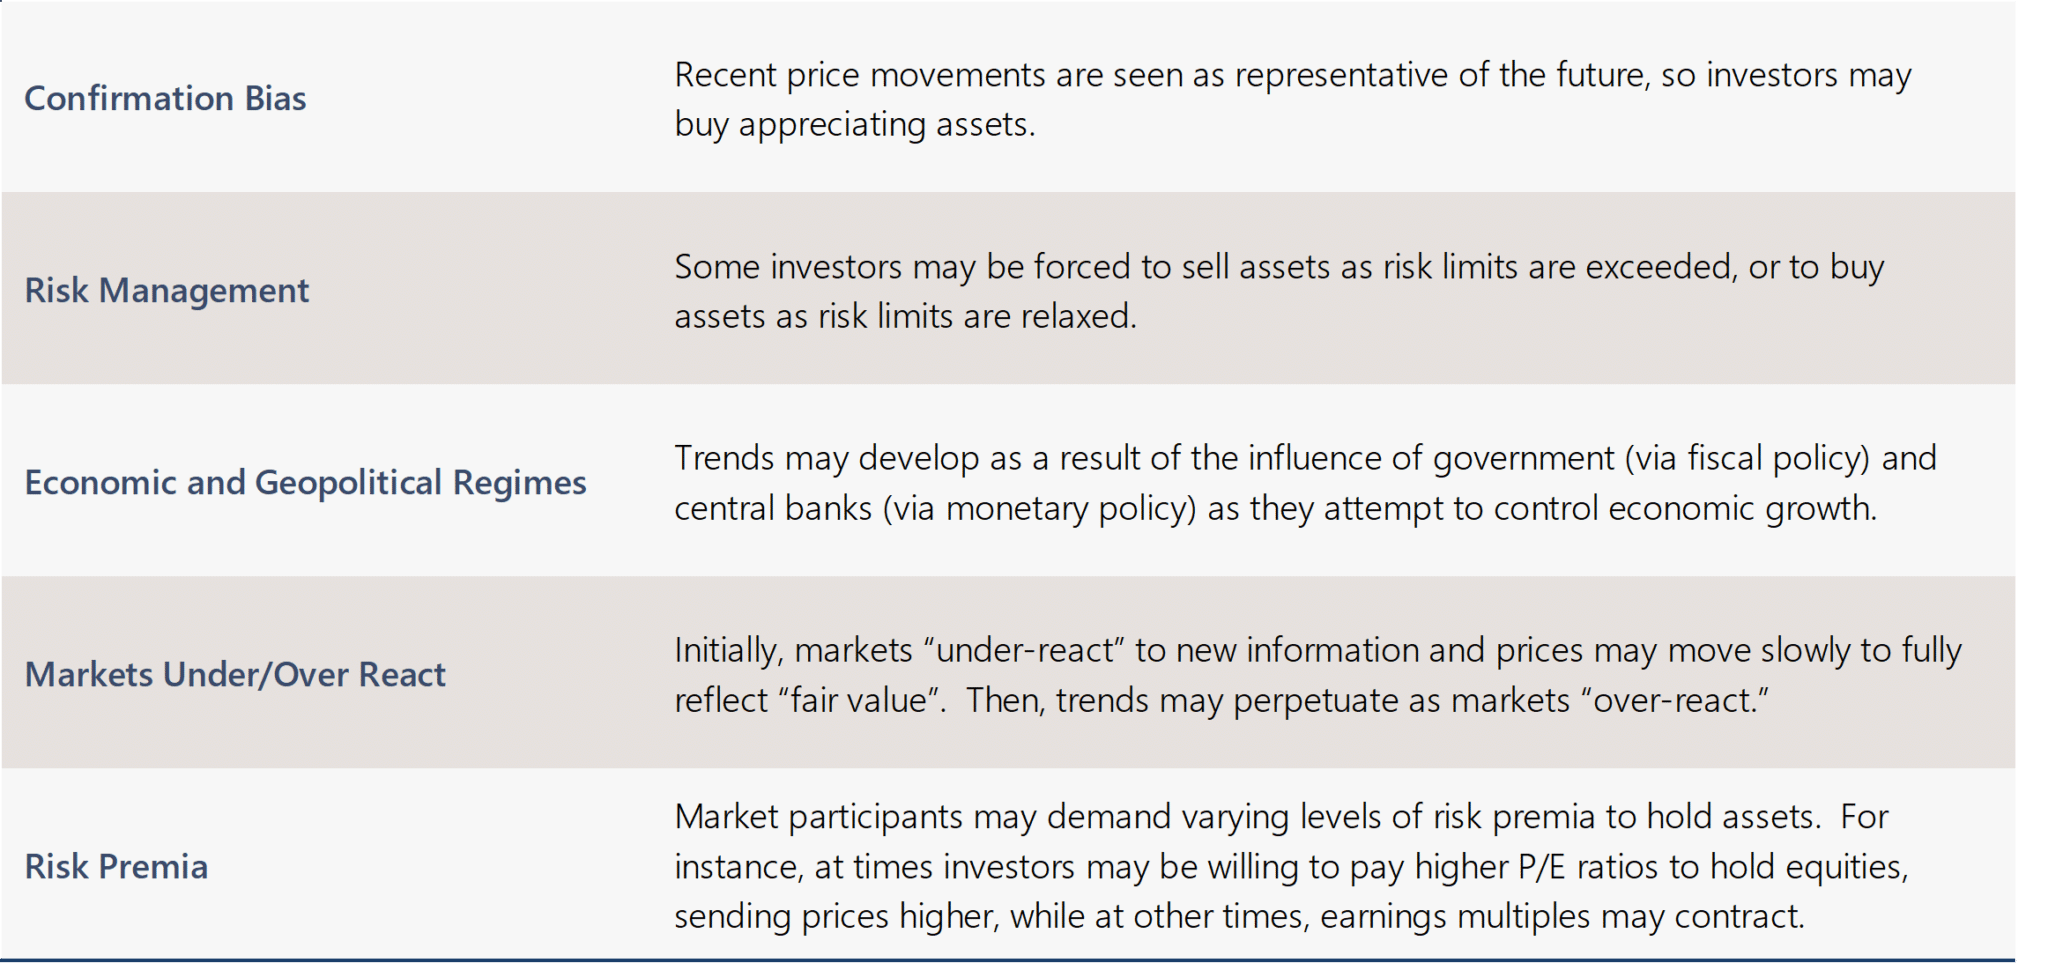
THEORETICAL FOUNDATION: WHY DO MARKETS TREND?
Trend-following performance depends on the existence of trends, or sustained directional moves in markets. Trends may exist both in times of market duress such as the 2008 financial crisis, or during relatively “normal” market environments. The theoretical rationale surrounding the existence of trends includes:
KEY CHARACTERISTICS OF TREND-FOLLOWING
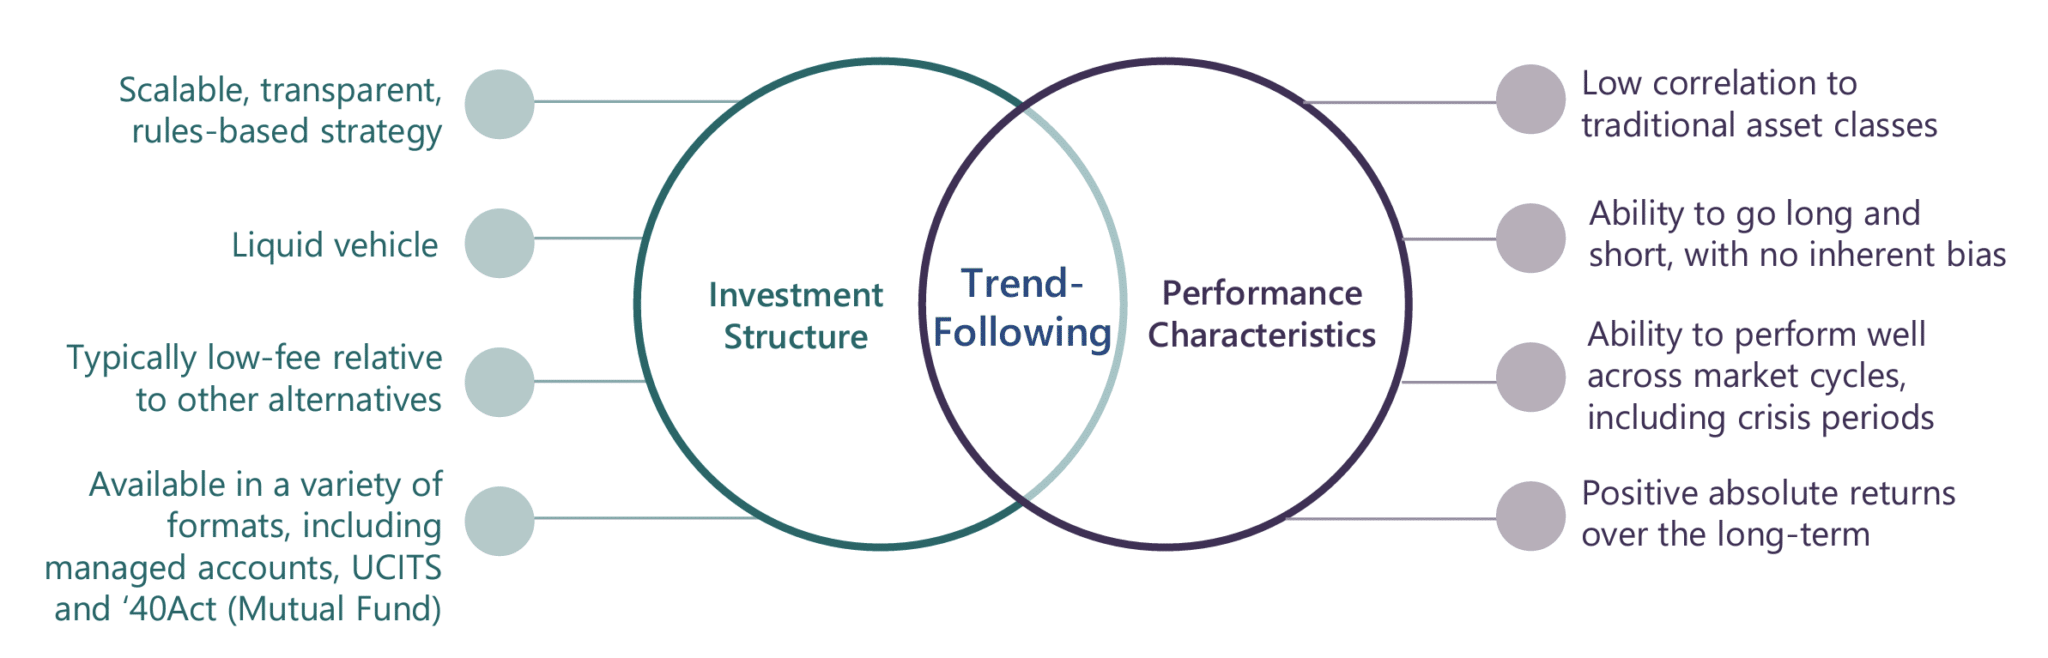
FAVORABLE INVESTMENT STRUCTURE
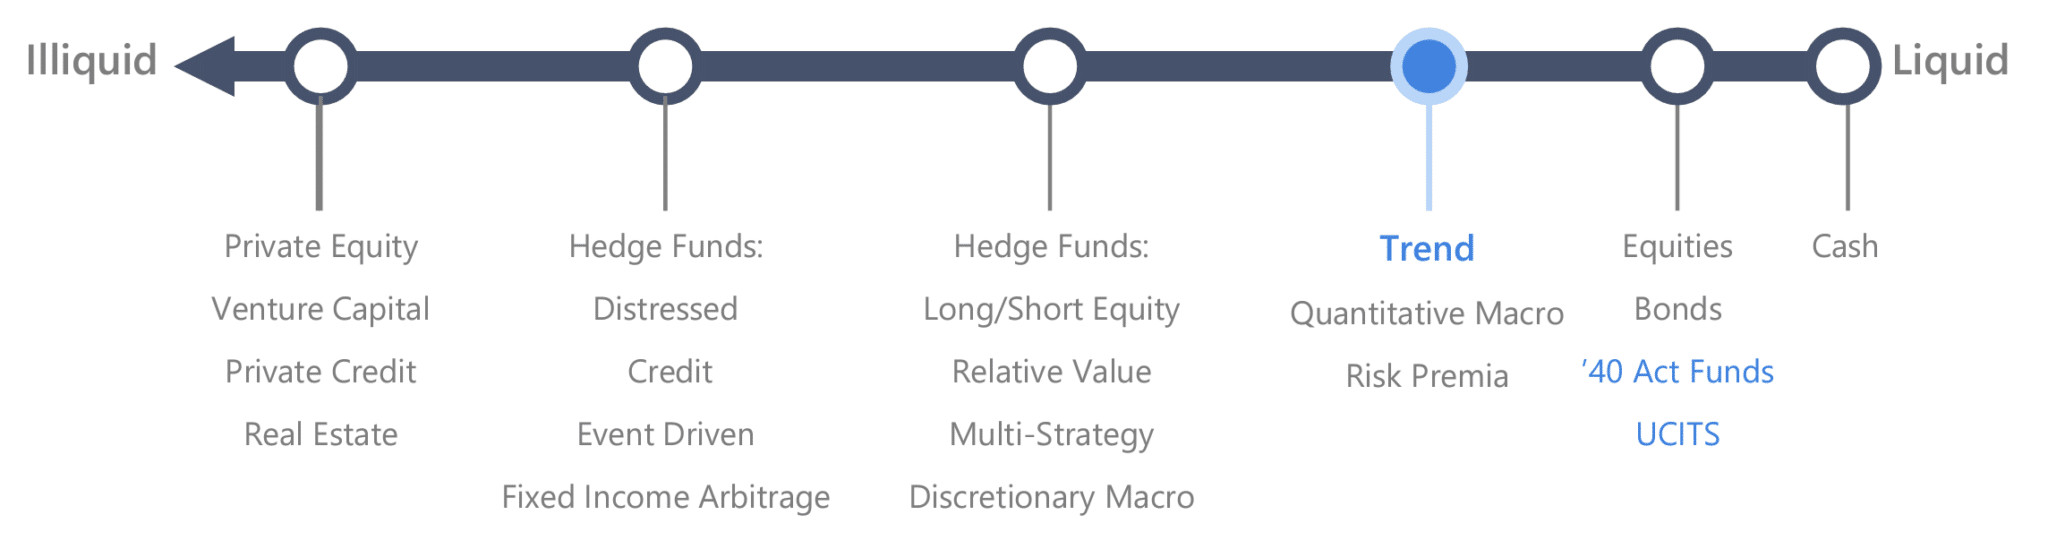
Trend-following strategies are available through liquid investment vehicles – including managed accounts, UCITS and ‘40Act (Mutual Fund) structures – with daily, weekly or monthly liquidity without lockups, gates or other constraints. Because the market universe is liquid and the rules-based investment approach is scalable, many trend-following funds are also available through registered vehicles, such as mutual funds and UCITS. These formats often translate to a high degree of transparency, including position-level reporting, and competitive fee structures.
NON-CORRELATED RETURNS2
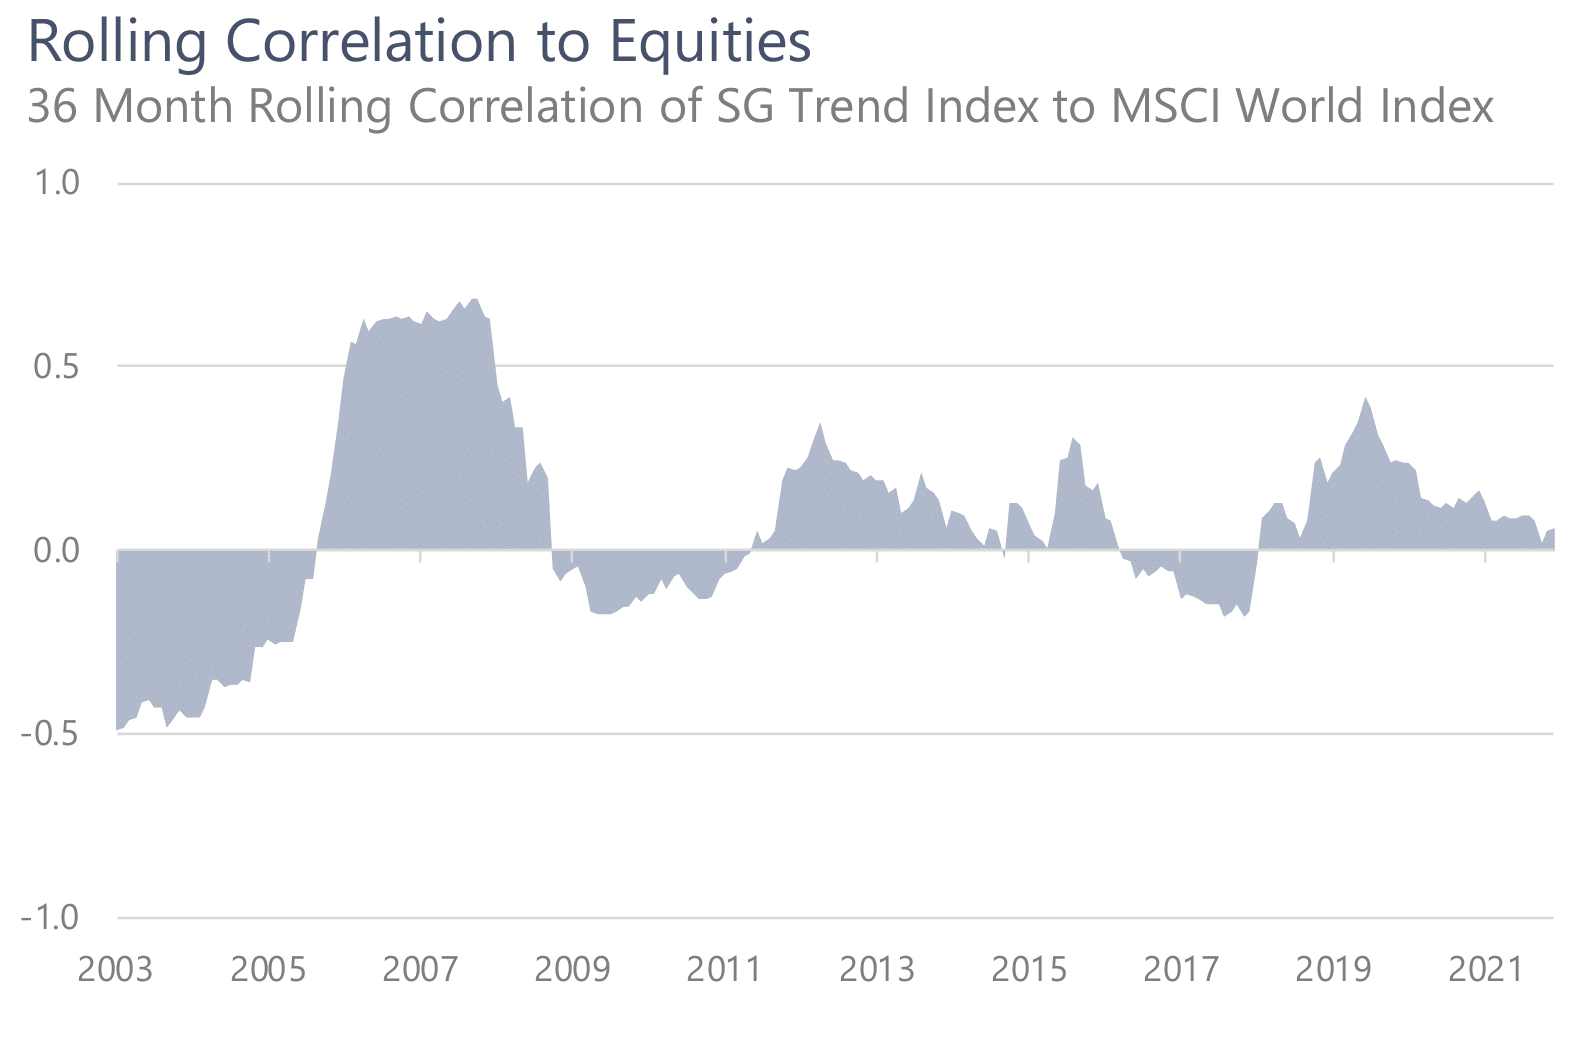
Over the long-term, trend-following has had low or even negative correlation to other investments. Trend-following strategies also tend to exhibit negative downside correlation to equity markets, providing the potential to perform well during periods of sustained stress in global equity markets. At any point in time, however, correlations may be positive or negative, including during crisis conditions. Therefore, trend-following strategies should not be treated exclusively as a portfolio hedge; rather, they may be viewed as additional sources of uncorrelated returns over intermediate to longer-term time periods.
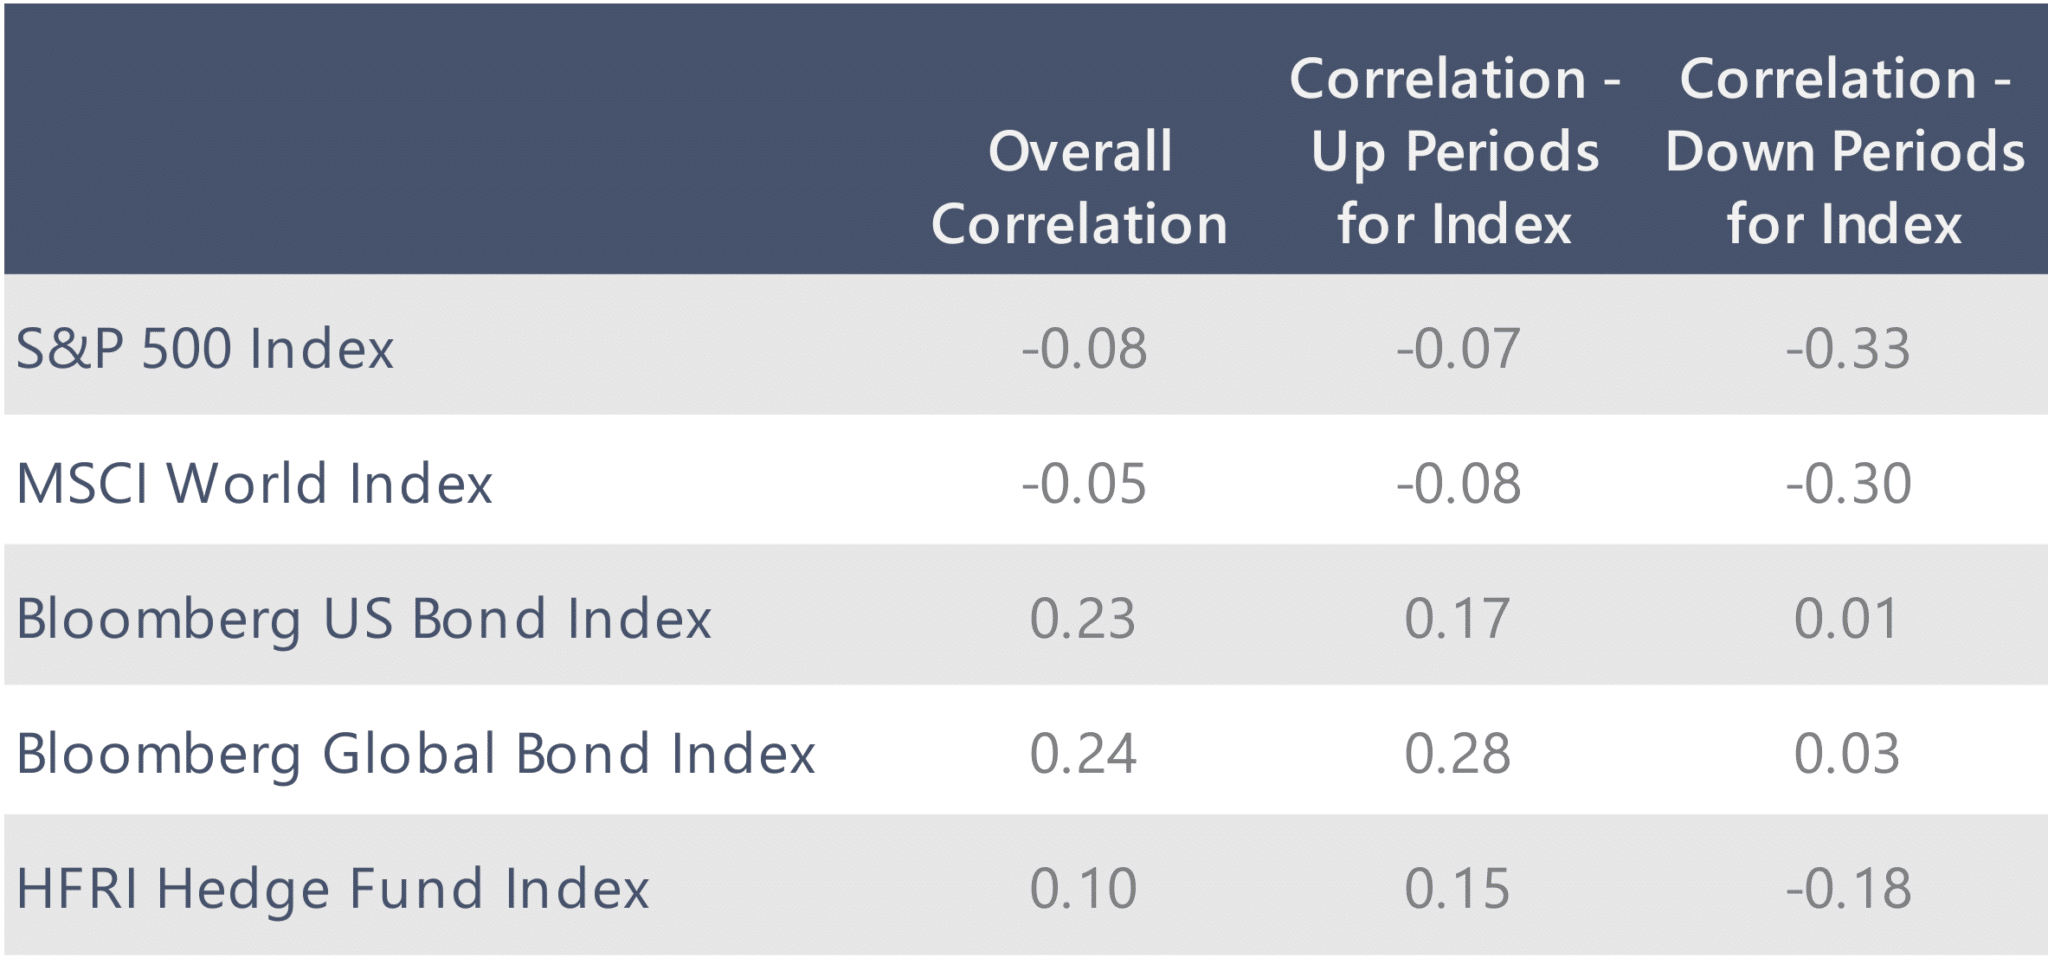
to Stocks, Bonds and Other Alternatives
NO STRUCTURAL LONG OR SHORT BIAS2
Non-correlation does not mean negative correlation. No structural long or short bias means that correlations may be positive or negative over different time horizons. Trend-following can perform well during both market rallies and during periods of negatively trending markets. On average, trend-following has no correlation to the markets that it trades and typically has positive correlation when markets move higher and negative correlation when markets decline.
ABILITY TO PERFORM WELL DURING EQUITY STRESS PERIODS2
Trend-following strategies can be profitable in both rising and falling markets and have a non-linear pay-off to their underlying market universe. This property is often referred to as convexity, which is a highly valued characteristic for investors seeking portfolio diversification. As shown below, trend-following exhibits strong positive convexity as it performs well during large directional moves (up or down), including equity stress periods.
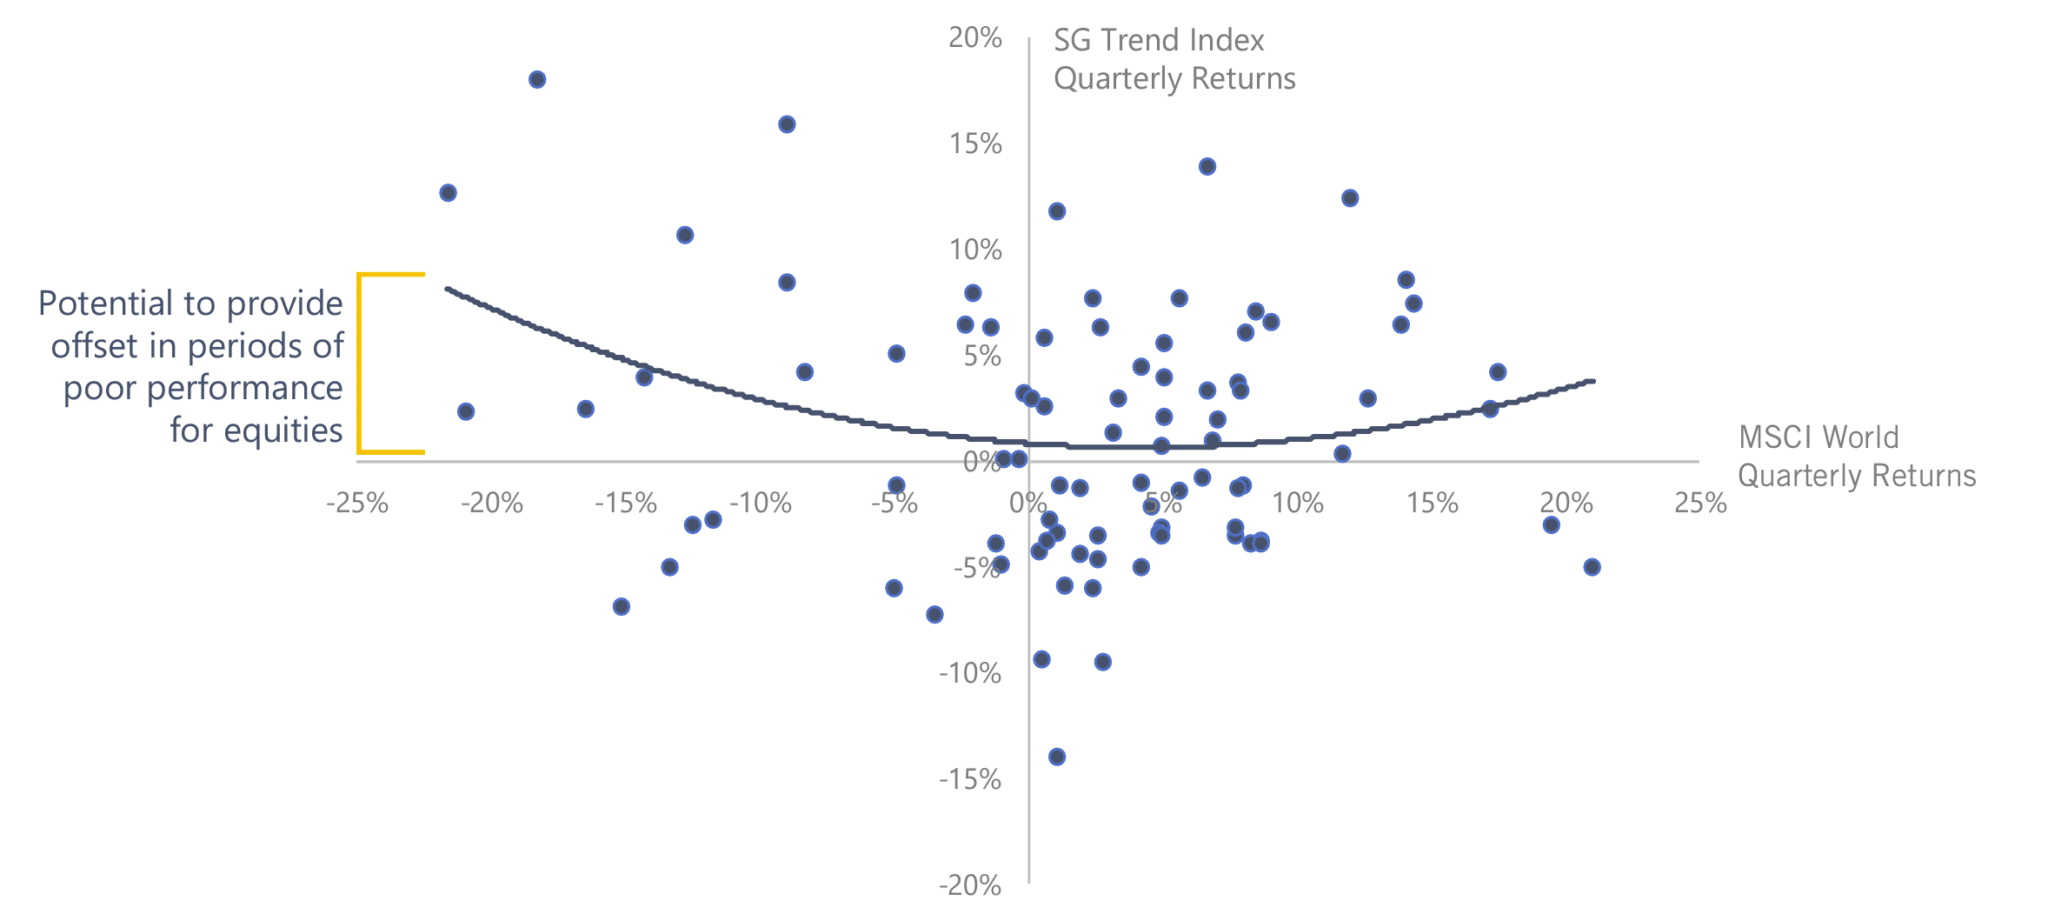
As noted earlier, trend-following should not be used as a pure tail hedge. Trend-following has historically performed well, on average, during equity sell-offs, but positive performance during equity downturns is not guaranteed. For example, while trend-following was a good hedge during longer-term market declines such as the burst of the technology bubble and the Global Financial Crisis, it did not provide protection during the shorter-term equity sell-off in Q4 2018. Importantly, sharp reversals and short-term declines can be challenging for trend-following.
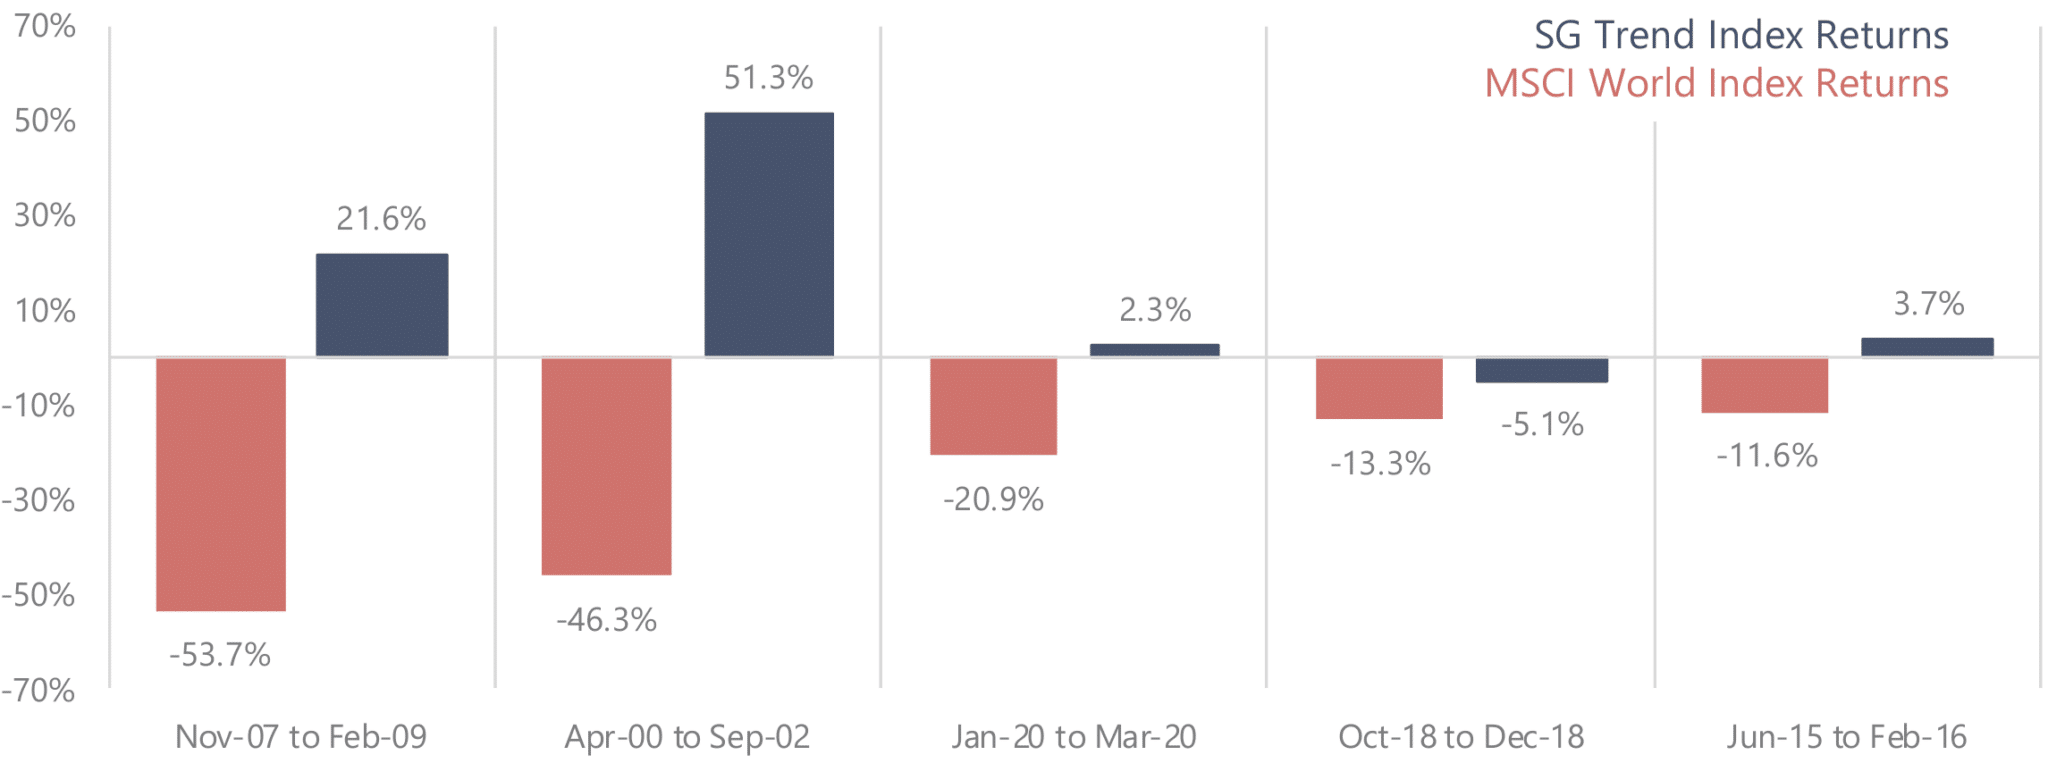
Trend-Following Performance During Equity Drawdowns2
Performance during 5 Worst Drawdowns for MSCI World Index
POSITIVE LONG-TERM RETURNS2
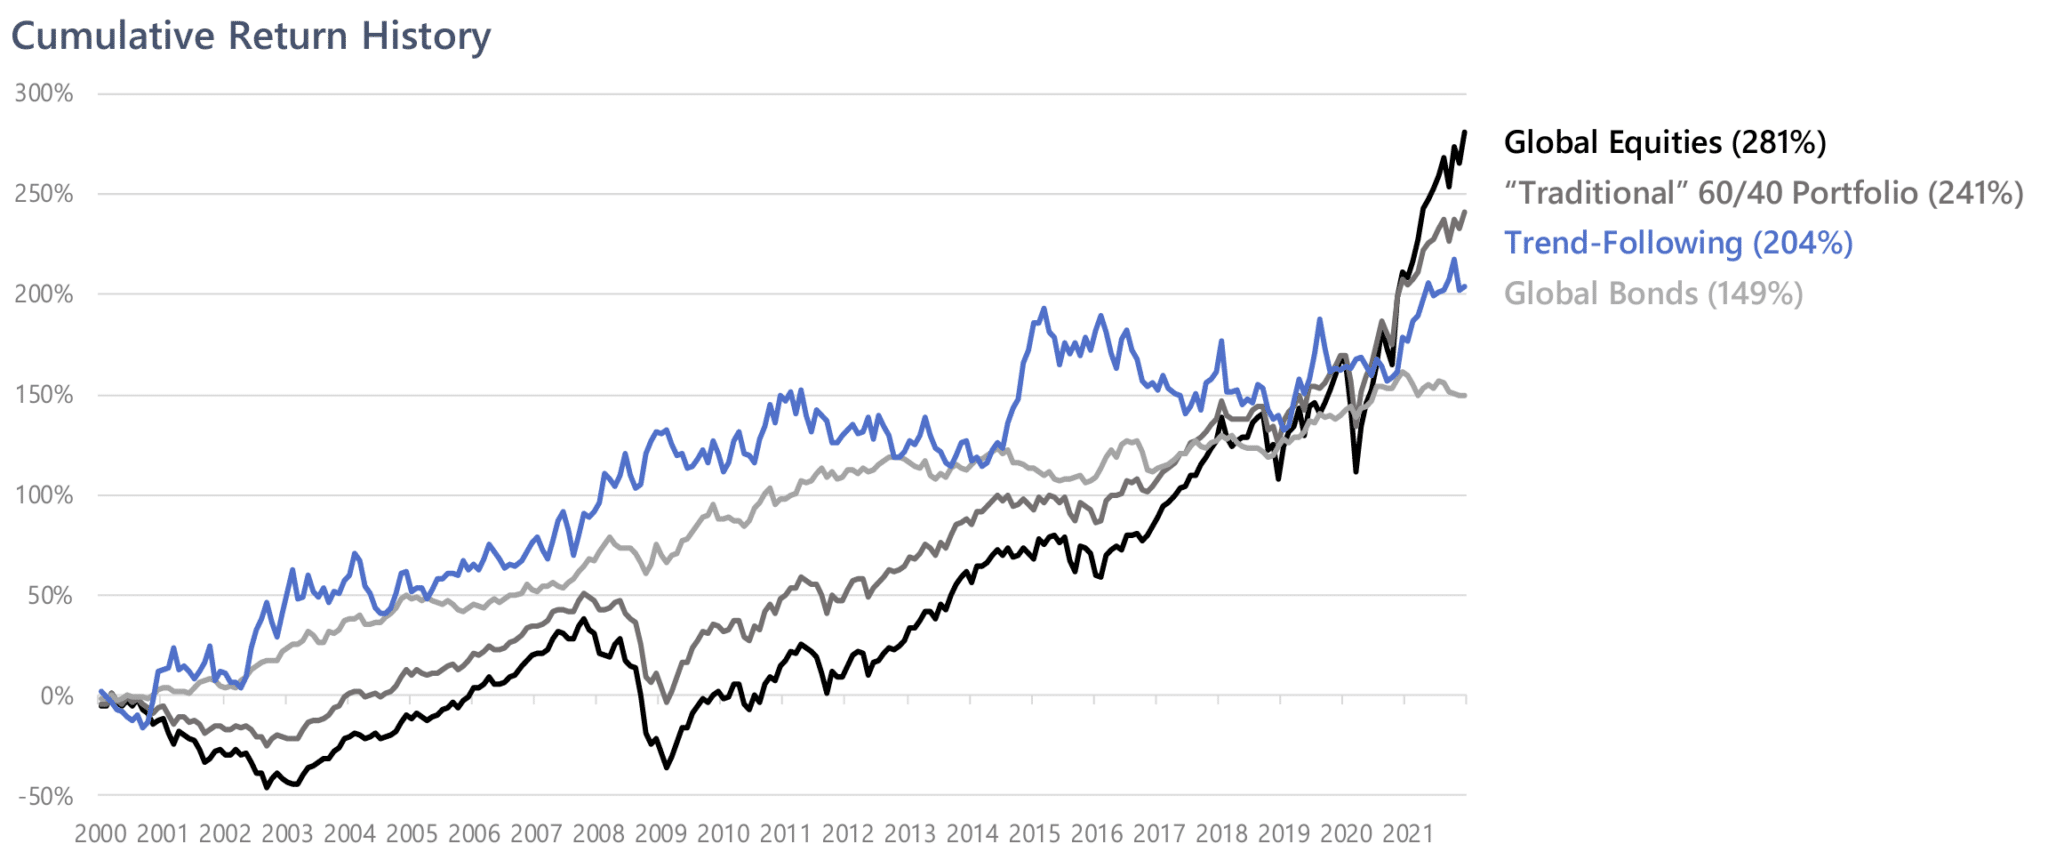
Like all asset classes, trend-following has periods of strong, challenging, and flat performance. Even with the recent 2015-2018 drawdown in trend-following, the strategy has maintained a strong return profile over the long-term.
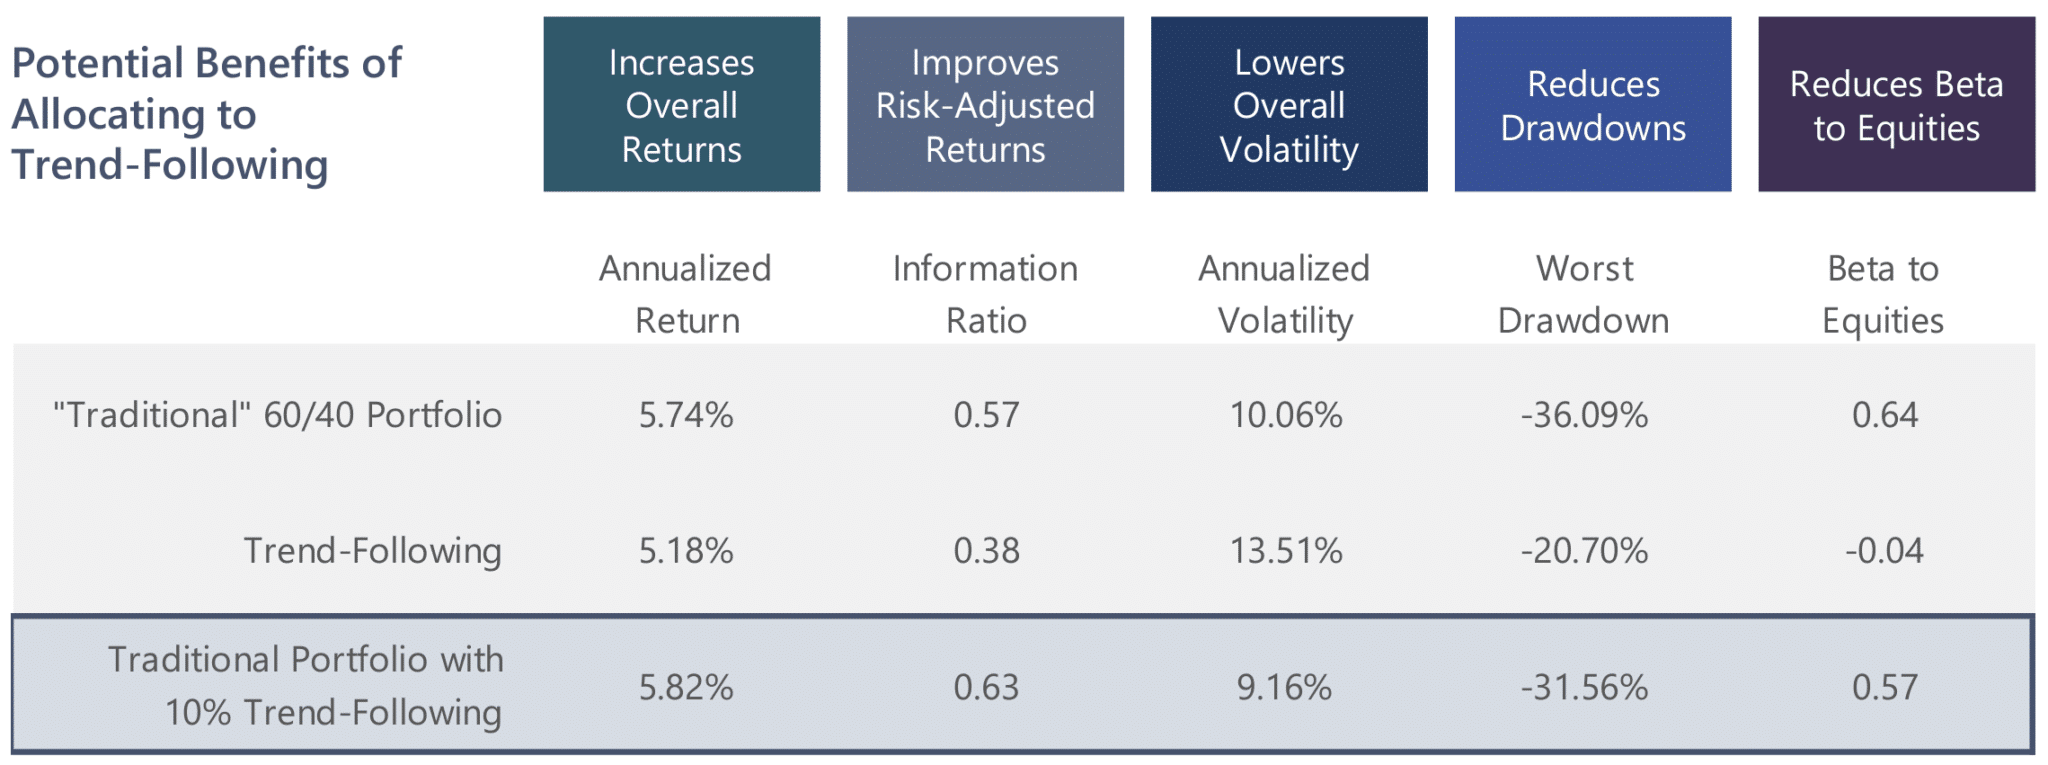
IMPLICATIONS FOR AN INVESTMENT PORTFOLIO2
Trend-following is a potentially valuable portfolio construction tool that has the ability to lower the volatility and soften the drawdowns of an overall portfolio while adding to returns over the long run. Importantly, trend-following returns are meant to complement – rather than compete with – traditional assets such as equities. And while it is unreasonable to expect the strategy to perform well at every discrete point in time, holding the strategy as a long-term, strategic allocation in a diversified investment portfolio offers the potential for significant benefits. As shown below, trend-following can have more modest returns in isolation, yet still offer a significant diversification benefit within an overall portfolio which serves to enhance overall returns.
IMPORTANT DISCLOSURE
REFERENCES
1 Total AUM in Trend-Following Strategies is sourced from BarclayHedge and represents estimated assets under management for the managed futures industry utilizing AUM information provided by contributing CTA managers as of September 30, 2021.
2All data herein is based on performance since SG Trend Index inception in January 2000 through December 2021.
PAST PERFORMANCE IS NOT NECESSARILY INDICATIVE OF FUTURE RESULTS.
DISCLOSURES AT THE END OF THIS DOCUMENT ARE AN INTEGRAL PART OF THIS DOCUMENT.
INDEX DISCLOSURE
The below are widely used indices that have been selected for comparison purposes only. Indices are unmanaged, and one cannot invest directly in an index. Except for HFR indices, which do reflect fees and expenses, the indices do not reflect any fees, expenses or sales charges. Unlike most asset class indices, hedge fund indices included in this presentation have limitations, which should be considered in connection with their use in this presentation. These limitations include survivorship bias (the returns of the indices may not be representative of all the hedge funds in the universe because of the tendency of lower performing funds to leave the index); heterogeneity (not all hedge funds are alike or comparable to one another, and the index may not accurately reflect the performance of a described style); and limited data (many hedge funds do not report to indices, and the index may omit funds which could significantly affect the performance shown; these indices are based on information self-reported by hedge fund managers which may decide at any time whether or not they want to continue to provide information to the index). These indices may not be complete or accurate representations of the hedge fund universe, and may be affected by the biases described above.
Bloomberg Global Bond Index: The Bloomberg Global Aggregate Bond Index is a broad-based market capitalization weighted measure of the global investment grade fixed-rate debt markets. This multi-currency benchmark includes treasury, government-related, corporate and securitized fixed-rate bonds from both developed and emerging markets issuers. There are four regional aggregate benchmarks that largely comprise the Global Aggregate Index: The US Aggregate, the Pan-European Aggregate, the Asian-Pacific Aggregate and the Canadian Aggregate Indices. The Global Aggregate Index also includes Eurodollar, Euro-Yen, and 144A Index-eligible securities, and debt from five local currency markets not tracked by the regional aggregate benchmarks (CLP, MXN, ZAR, ILS and TRY).
Bloomberg US Aggregate Bond Index: The Bloomberg US Aggregate Bond Index, formerly known as the Barclays Capital Aggregate Bond Index, is a broad based market capitalization weighted index used to represent investment grade bonds being traded in the United States. Most U.S.-traded investment grade bonds are represented. Municipal bonds and Treasury Inflation-Protected Securities are excluded, due to tax treatment issues. The index includes Treasury securities, government agency bonds, mortgage-backed bonds, corporate bonds, and a small amount of foreign bonds traded in the U.S.
HFRI Fund Weighted Composite Index: The HFRI Fund Weighted Composite Index is an equal-weighted index that includes over 2000 constituent funds which have at least $50M under management or have been actively traded for at least 12 months. There are no fund of funds included in this index. All funds are reported in USD and returns are reported net of all fees on a monthly basis.
MSCI World Index: A market cap weighted stock market index of 1,652 global stocks and is used as a common benchmark for ‘world’ or ‘global’ stock funds. The index includes a collection of stocks of all the developed markets in the world, as defined by MSCI. The index includes securities from 23 countries but excludes stocks from emerging and frontier economies.
SG Trend Index: SG Trend Index is a subset of the SG CTA Index and is designed to track the 10 largest (by AUM) trend following CTAs and be representative of the trend followers in the managed futures space. Managers must meet the following criteria: must be open to new investment; must report returns on a daily basis; must be an industry recognized trend follower as determined at the discretion of the SG Index Committee; and must exhibit significant correlation to trend following peers and the SG Trend Indicator. The SG Trend Index is equally weighted, and rebalanced and reconstituted annually.
S&P 500 Total Return Index: An unmanaged, market value-weighted index measuring the performance of 500 U.S. stocks chosen for market size, liquidity, and industry group representation. Includes the reinvestment of dividends. The S&P 500 index components and their weightings are determined by S&P Dow Jones Indices.
Traditional 60/40 Portfolio: Reflects a portfolio with a 60% allocation to equities and a 40% allocation to bonds as represented by the MSCI World Index and the Bloomberg Barclays Global Bond Index, rebalanced monthly.
Traditional Portfolio with 10% Trend-Following: Reflects a portfolio with a 56% allocation to equities, 36% allocation to bonds, and 10% allocation to trend-following, as represented by the MSCI World Index, Bloomberg Barclays Global Bond Index, and the SG Trend Index, respectively, rebalanced monthly.
LEGAL DISCLAIMER
Source of data: Graham Capital Management (“Graham”), unless otherwise stated
This document is neither an offer to sell nor a solicitation of any offer to buy shares in any fund managed by Graham and should not be relied on in making any investment decision. Any offering is made only pursuant to the relevant prospectus, together with the current financial statements of the relevant fund and the relevant subscription documents all of which must be read in their entirety. No offer to purchase shares will be made or accepted prior to receipt by the offeree of these documents and the completion of all appropriate documentation. The shares have not and will not be registered for sale, and there will be no public offering of the shares. No offer to sell (or solicitation of an offer to buy) will be made in any jurisdiction in which such offer or solicitation would be unlawful. No representation is given that any statements made in this document are correct or that objectives will be achieved. This document may contain opinions of Graham and such opinions are subject to change without notice. Information provided about positions, if any, and attributable performance is intended to provide a balanced commentary, with examples of both profitable and loss-making positions, however this cannot be guaranteed.
It should not be assumed that investments that are described herein will be profitable. Nothing described herein is intended to imply that an investment in the fund is safe, conservative, risk free or risk averse. An investment in funds managed by Graham entails substantial risks and a prospective investor should carefully consider the summary of risk factors included in the Private Offering Memorandum entitled “Risk Factors” in determining whether an investment in the Fund is suitable. This investment does not consider the specific investment objective, financial situation or particular needs of any investor and an investment in the funds managed by Graham is not suitable for all investors. Prospective investors should not rely upon this document for tax, accounting or legal advice. Prospective investors should consult their own tax, legal accounting or other advisors about the issues discussed herein. Investors are also reminded that past performance should not be seen as an indication of future performance and that they might not get back the amount that they originally invested. The price of shares of the funds managed by Graham can go down as well as up and be affected by changes in rates of exchange. No recommendation is made positive or otherwise regarding individual securities mentioned herein.
This presentation includes statements that may constitute forward-looking statements. These statements may be identified by words such as “expects,” “looks forward to,” “anticipates,” “intends,” “plans,” “believes,” “seeks,” estimates,” “will,” “project” or words of similar meaning. In addition, our representatives may from time to time make oral forward-looking statements. Such statements are based on the current expectations and certain assumptions of GCM’s management, and are, therefore, subject to certain risks and uncertainties. A variety of factors, many of which are beyond GCM’s control, affect the operations, performance, business strategy and results of the accounts that it manages and could cause the actual results, performance or achievements of such accounts to be materially different from any future results, performance or achievements that may be expressed or implied by such forward-looking statements or anticipated on the basis of historical trends.
Tables, charts and commentary contained in this document have been prepared on a best efforts basis by Graham using sources it believes to be reliable although it does not guarantee the accuracy of the information on account of possible errors or omissions in the constituent data or calculations. No part of this document may be divulged to any other person, distributed, resold and/or reproduced without the prior written permission of Graham.
