In 2022, 60/40 portfolios suffered as both stocks and bonds sold off and the power of bonds as a diversifier (and, accordingly, a means of reducing portfolio volatility) deteriorated. Meanwhile, inflation exacerbated the issue and eroded real returns. These challenges indicate an increased need for alternatives that offer both diversification to equities and bonds as well as compelling long-term returns.
IN 2022, MANY INVESTORS FACED SEVERAL KEY CHALLENGES
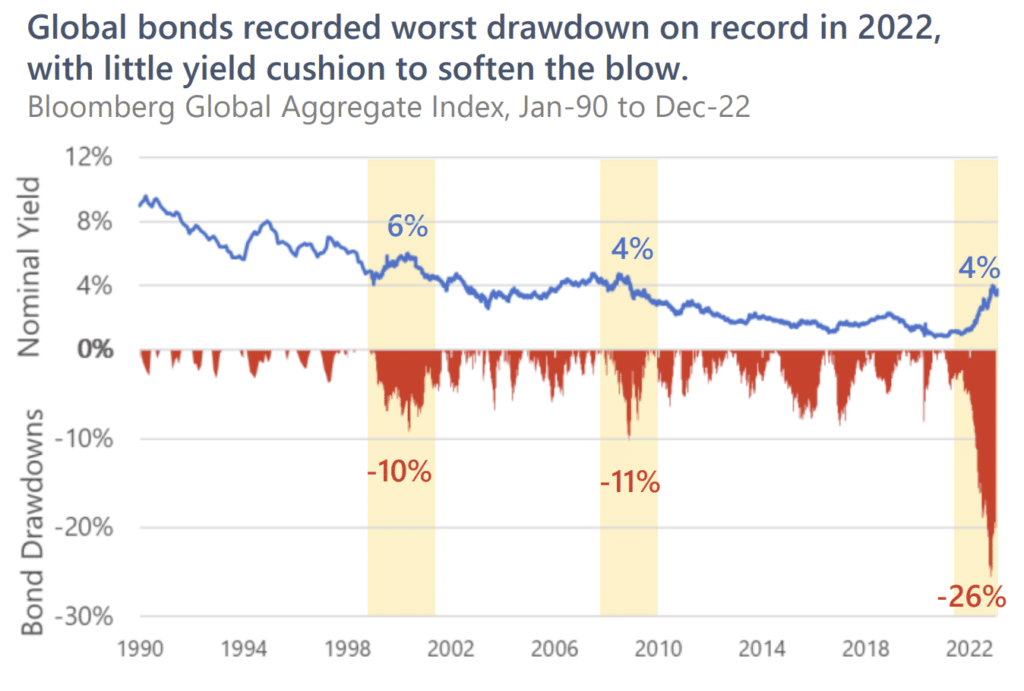
1) Diminishing Returns of a 60/40 Portfolio
Both equities and bonds suffered deep drawdowns in 2022. While the trajectory for equities is marked with uncertainty, bond return potential has diminished as historically low yields translate to lower coupon payments, negative real yields, and less scope for price appreciation.
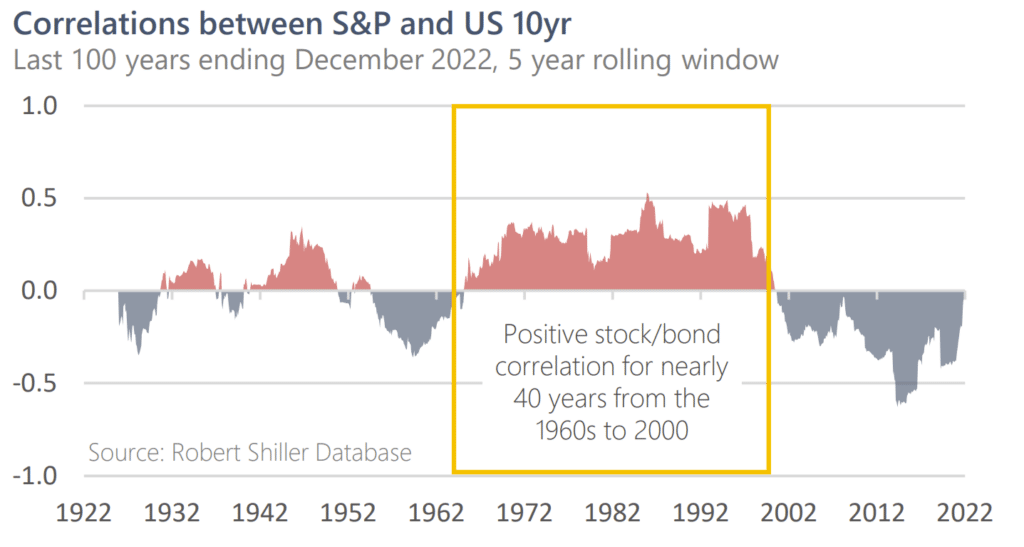
2) Positive Stock/Bond Correlation
Equity/bond relationships are not static, and there have been extended periods of positive stock/bond correlation. Today, historically low yields mean that the protective character of bonds is in jeopardy and investors may see positive correlations between stocks and bonds.
3) Volatility and Market Uncertainty
Given geopolitical developments and macro imbalances, markets exhibited increased volatility in 2022 alongside the potential for market shocks. Should the equity hedging benefits of bonds continue to diminish, as it had in 2022, the ability to manage portfolio volatility will become more challenging.
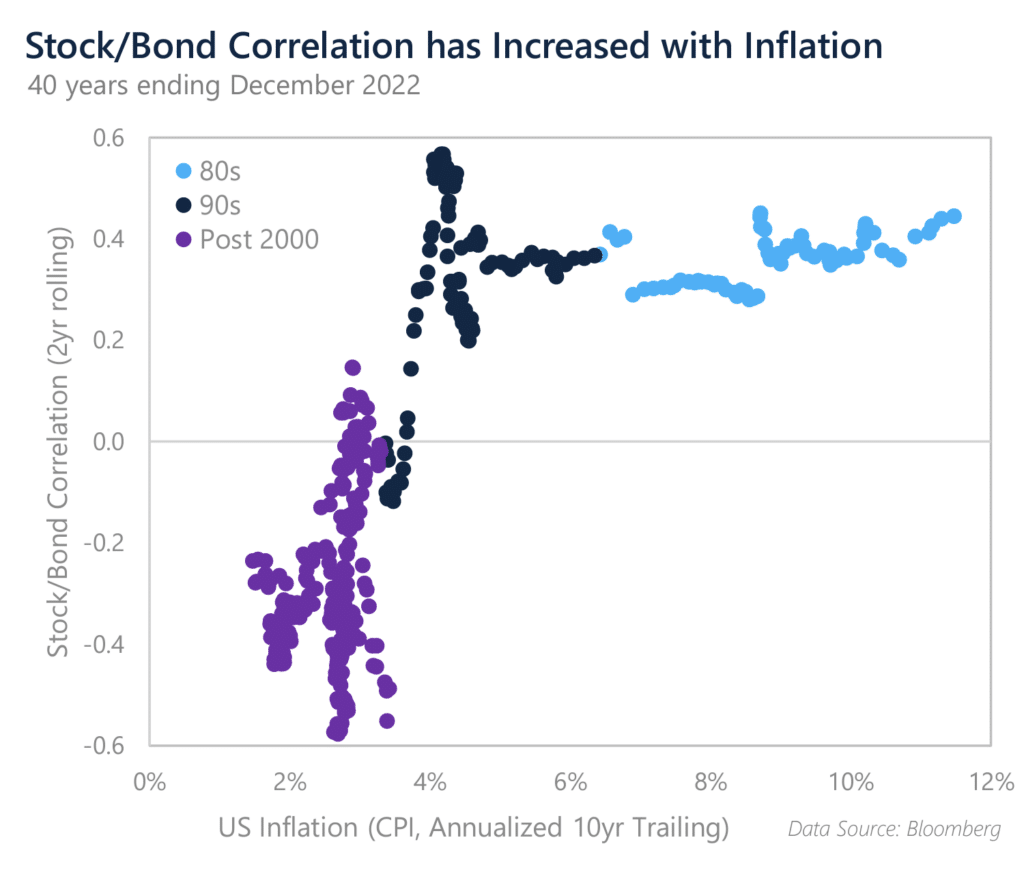
4) Inflation Sensitivity
CPI reached a 40-year high of 9.1% in June 2022. Elevated inflation presents a significant risk to stock/bond portfolios in terms of asset valuation, erosion of real returns, and positive correlation. When inflation rises, real yields decline alongside the market price of bonds. Inflation can also weigh on stocks when combined with hawkish monetary policy, as we saw in the 1970s, potentially leading to simultaneous losses in stocks and bonds and positive correlations.
PAST PERFORMANCE IS NOT NECESSARILY INDICATIVE OF FUTURE RESULTS. DISCLOSURES AT THE END OF THIS DOCUMENT ARE AN INTEGRAL PART OF THIS DOCUMENT.
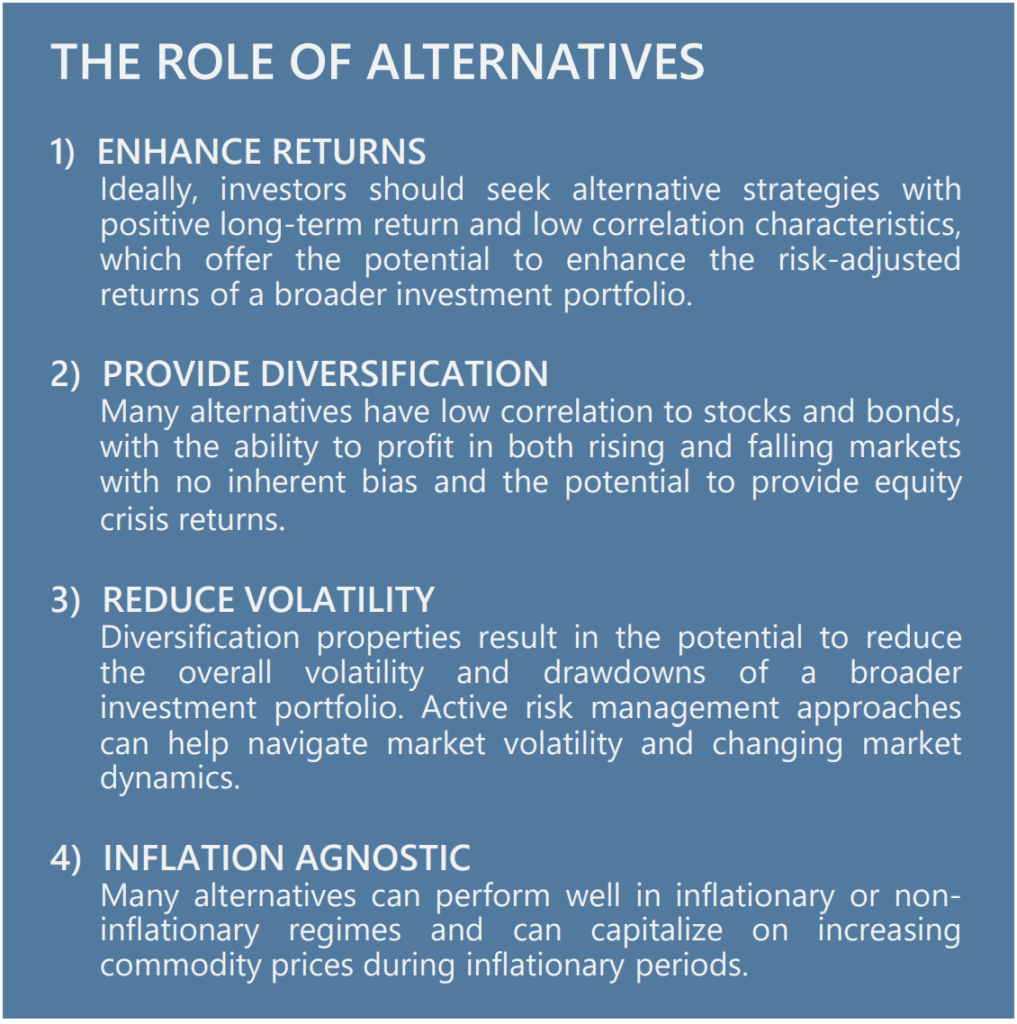
WHERE CAN INVESTORS TURN TO FOR DIVERSIFICATION? NOT ALL ALTERNATIVES ARE CREATED EQUAL
Many investors seek diversification through alternative strategies. However, not all alternatives provide the desired diversification benefits. Diversification benefits vary significantly across styles, and many strategies have positive correlation during equity down markets.
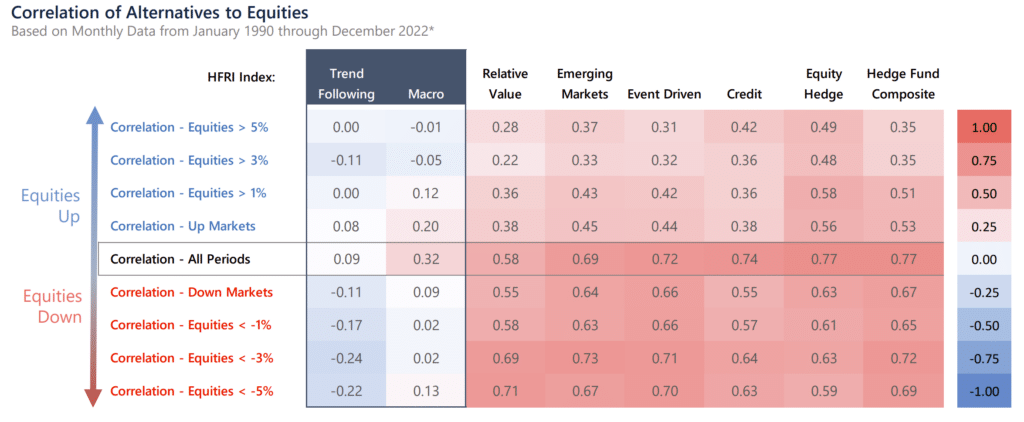
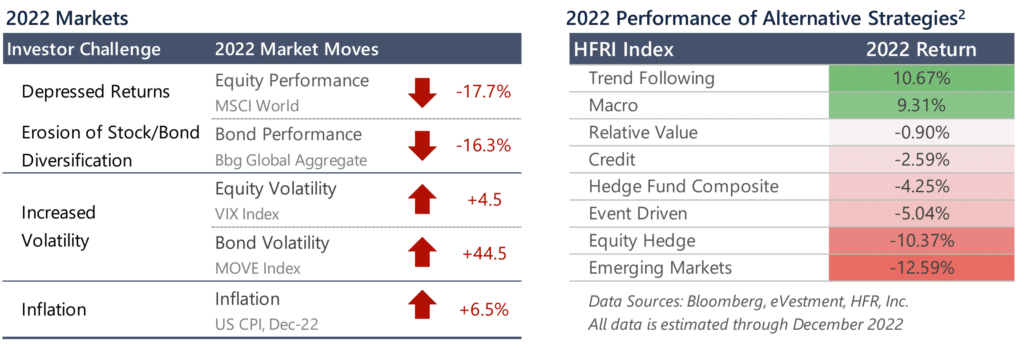
2022 CASE STUDY
In 2022, markets experienced a trifecta of a selloff in equity and bond markets, increased market volatility, and elevated inflation, making it a difficult year for many investors. From an asset allocation perspective, investors should consider allocating to alternative strategies that, ideally, have positive long-term return potential and diversifying characteristics during difficult equity environments. Importantly, diversification should be a constant rather than a reaction to short-term market conditions.
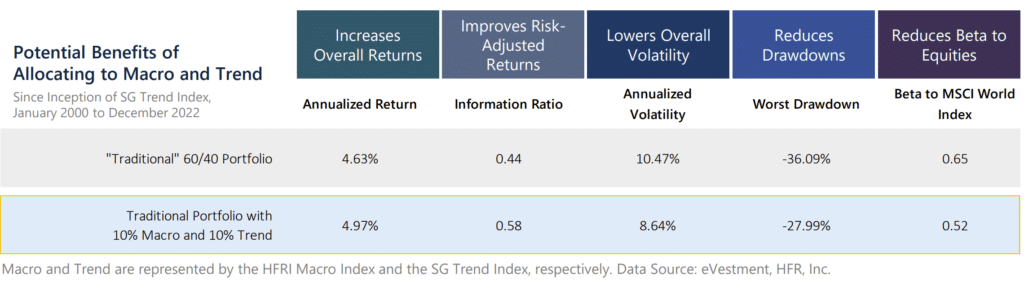
LONG-TERM BENEFITS
Market conditions continually change, and the best way to construct a portfolio resilient to changing market regimes is through proper diversification. Allocating to strategies that have low correlation to equities and bonds can be a valuable portfolio construction tool with the potential to lower the volatility and soften the drawdowns of an overall portfolio while adding to returns over the long run. These strategies are meant to complement – rather than compete with – traditional investments. And while it is unreasonable to expect any strategy to perform well at every discrete point in time, holding diversifying alternatives as a long-term, strategic allocation in a diversified investment portfolio offers the potential for significant benefits.
Below, we show the impact of allocating to macro and trend following strategies, which are widely regarded as effective diversifiers within an investment portfolio.
IMPORTANT DISCLOSURE
LEGAL DISCLAIMER
Source of data: Graham Capital Management (“Graham”), unless otherwise stated
This document is neither an offer to sell nor a solicitation of any offer to buy shares in any fund managed by Graham and should not be relied on in making any investment decision. Any offering is made only pursuant to the relevant prospectus, together with the current financial statements of the relevant fund and the relevant subscription documents all of which must be read in their entirety. No offer to purchase shares will be made or accepted prior to receipt by the offeree of these documents and the completion of all appropriate documentation. The shares have not and will not be registered for sale, and there will be no public offering of the shares. No offer to sell (or solicitation of an offer to buy) will be made in any jurisdiction in which such offer or solicitation would be unlawful. No representation is given that any statements made in this document are correct or that objectives will be achieved. This document may contain opinions of Graham and such opinions are subject to change without notice. Information provided about positions, if any, and attributable performance is intended to provide a balanced commentary, with examples of both profitable and loss-making positions, however this cannot be guaranteed.
It should not be assumed that investments that are described herein will be profitable. Nothing described herein is intended to imply that an investment in the fund is safe, conservative, risk free or risk averse. An investment in funds managed by Graham entails substantial risks and a prospective investor should carefully consider the summary of risk factors included in the Private Offering Memorandum entitled “Risk Factors” in determining whether an investment in the Fund is suitable. This investment does not consider the specific investment objective, financial situation or particular needs of any investor and an investment in the funds managed by Graham is not suitable for all investors. Prospective investors should not rely upon this document for tax, accounting or legal advice. Prospective investors should consult their own tax, legal accounting or other advisors about the issues discussed herein. Investors are also reminded that past performance should not be seen as an indication of future performance and that they might not get back the amount that they originally invested. The price of shares of the funds managed by Graham can go down as well as up and be affected by changes in rates of exchange. No recommendation is made positive or otherwise regarding individual securities mentioned herein.
This presentation includes statements that may constitute forward-looking statements. These statements may be identified by words such as “expects,” “looks forward to,” “anticipates,” “intends,” “plans,” “believes,” “seeks,” estimates,” “will,” “project” or words of similar meaning. In addition, our representatives may from time to time make oral forward-looking statements. Such statements are based on the current expectations and certain assumptions of GCM’s management, and are, therefore, subject to certain risks and uncertainties. A variety of factors, many of which are beyond GCM’s control, affect the operations, performance, business strategy and results of the accounts that it manages and could cause the actual results, performance or achievements of such accounts to be materially different from any future results, performance or achievements that may be expressed or implied by such forward-looking statements or anticipated on the basis of historical trends.
Tables, charts and commentary contained in this document have been prepared on a best efforts basis by Graham using sources it believes to be reliable although it does not guarantee the accuracy of the information on account of possible errors or omissions in the constituent data or calculations. No part of this document may be divulged to any other person, distributed, resold and/or reproduced without the prior written permission of Graham.
INDEX DISCLOSURE
The below are widely used indices that have been selected for comparison purposes only. Indices are unmanaged, and one cannot invest directly in an index. Except for HFR indices, which do reflect fees and expenses, the indices do not reflect any fees, expenses or sales charges. Unlike most asset class indices, hedge fund indices included in this presentation have limitations, which should be considered in connection with their use in this presentation. These limitations include survivorship bias (the returns of the indices may not be representative of all the hedge funds in the universe because of the tendency of lower performing funds to leave the index); heterogeneity (not all hedge funds are alike or comparable to one another, and the index may not accurately reflect the performance of a described style); and limited data (many hedge funds do not report to indices, and the index may omit funds which could significantly affect the performance shown; these indices are based on information self-reported by hedge fund managers which may decide at any time whether or not they want to continue to provide information to the index). These indices may not be complete or accurate representations of the hedge fund universe and may be affected by the biases described above.
BLOOMBERG GLOBAL BOND INDEX: The Bloomberg Global Aggregate Bond Index is a broad-based market capitalization weighted measure of the global investment grade fixed-rate debt markets. This multi-currency benchmark includes treasury, government-related, corporate and securitized fixed-rate bonds from both developed and emerging markets issuers. There are four regional aggregate benchmarks that largely comprise the Global Aggregate Index: The US Aggregate, the Pan-European Aggregate, the Asian-Pacific Aggregate and the Canadian Aggregate Indices. The Global Aggregate Index also includes Eurodollar, Euro-Yen, and 144A Index-eligible securities, and debt from five local currency markets not tracked by the regional aggregate benchmarks (CLP, MXN, ZAR, ILS and TRY).
HFRI MACRO INDEX: The HFRI Macro Index is a sub-index of the HFRI Fund Weighted Composite Index and is composite index of over 900 Investment Managers which trade a broad range of strategies in which the investment process is predicated on movements in underlying economic variables and the impact these have on equity, fixed income, hard currency and commodity markets.
HFRI TREND FOLLOWING DIRECTIONAL INDEX: The HFRI Trend Following Directional Index is a global, equal-weighted index of single-manager funds that report to the HFR Database. The HFRI Trend Following Directional Index is comprised of funds that employ trend following strategies such as Macro: Currency – Systematic, Macro: Systematic Diversified, certain Macro: Multi-Strategy funds and other Macro funds that utilize, to some degree, trend following.
HFRI RELATIVE VALUE INDEX: Investment Managers who maintain positions in which the investment thesis is predicated on realization of a valuation discrepancy in the relationship between multiple securities. Managers employ a variety of fundamental and quantitative techniques to establish investment theses, and security types range broadly across equity, fixed income, derivative or other security types. Fixed income strategies are typically quantitatively driven to measure the existing relationship between instruments and, in some cases, identify attractive positions in which the risk adjusted spread between these instruments represents an attractive opportunity for the investment manager. RV position may be involved in corporate transactions also, but as opposed to ED exposures, the investment thesis is predicated on realization of a pricing discrepancy between related securities, as opposed to the outcome of the corporate transaction.
HFRI EMERGING MARKETS INDEX: Emerging Markets funds invest, primarily long, in securities of companies or the sovereign debt of developing or ’emerging’ countries. Emerging Markets regions include Africa, Asia ex-Japan, Latin America, the Middle East and Russia/Eastern Europe. Emerging Markets – Global funds will shift their weightings among these regions according to market conditions and manager perspectives.
HFRI EVENT DRIVEN INDEX: Investment Managers who maintain positions in companies currently or prospectively involved in corporate transactions of a wide variety including but not limited to mergers, restructurings, financial distress, tender offers, shareholder buybacks, debt exchanges, security issuance or other capital structure adjustments. Security types can range from most senior in the capital structure to most junior or subordinated, and frequently involve additional derivative securities. Event Driven exposure includes a combination of sensitivities to equity markets, credit markets and idiosyncratic, company specific developments. Investment theses are typically predicated on fundamental characteristics (as opposed to quantitative), with the realization of the thesis predicated on a specific development exogenous to the existing capital structure.
HFRI CREDIT INDEX: HFRI Credit Index is a composite index of strategies trading primarily in credit markets. It is an aggregation of following 7 HFRI substrategy indices. HFRI ED: Credit Arbitrage Index, HFRI ED: Distressed/Restructuring Index, HFRI ED: Multi-Strategy Index, HFRI RV: Fixed Income-Asset Backed Index, HFRI RV: Fixed Income-Convertible Arbitrage Index, HFRI RV: Fixed Income-Corporate Index, and HFRI RV: Multi-Strategy Index.
HFRI EQUITY HEDGE INDEX: Investment Managers who maintain positions both long and short in primarily equity and equity derivative securities. A wide variety of investment processes can be employed to arrive at an investment decision, including both quantitative and fundamental techniques; strategies can be broadly diversified or narrowly focused on specific sectors and can range broadly in terms of levels of net exposure, leverage employed, holding period, concentrations of market capitalizations and valuation ranges of typical portfolios. EH managers would typically maintain at least 50% exposure to, and may in some cases be entirely invested in, equities, both long and short.
HFRI COMPOSITE INDEX: The HFRI Fund Weighted Composite Index is a global, equal-weighted index of single-manager funds that report to HFR Database. Constituent funds report monthly net of all fees performance in US Dollar and have a minimum of $50 Million under management or $10 Million under management and a twelve (12) month track record of active performance. The HFRI Fund Weighted Composite Index does not include Funds of Hedge Funds.
MSCI WORLD INDEX: A market cap weighted stock market index of 1,652 global stocks and is used as a common benchmark for ‘world’ or ‘global’ stock funds. The index includes a collection of stocks of all the developed markets in the world, as defined by MSCI. The index includes securities from 23 countries but excludes stocks from emerging and frontier economies.
S&P 500 TOTAL RETURN INDEX: An unmanaged, market value-weighted index measuring the performance of 500 U.S. stocks chosen for market size, liquidity, and industry group representation. Includes the reinvestment of dividends. The S&P 500 index components and their weightings are determined by S&P Dow Jones Indices.
Stocks and bonds are represented by the MSCI World Index and the Bloomberg Global Aggregate Index, respectively, unless otherwise noted.
