IN BRIEF
Low-correlated alternatives such as global macro are designed to be strategic allocations that add value over time by providing diversification to other strategies in a portfolio. Many investors understand the importance of diversification in building a portfolio that is resilient to various market conditions and able to more consistently meet investment objectives over time. Nonetheless, in the decade preceding the global disruptions of 2022, fear of missing out on the seemingly persistent growth of the 60/40 portfolio left many investors without sufficient diversification (right before it was needed most). Global macro emerged as a notable winner in 2022 amidst a dispersion in results across various alternative investment styles. This leads many investors to ask: Has this opportunity passed? When is the right time to allocate to macro?
Here, we address some common questions on why and when to allocate to macro.
MACRO STRATEGIES GENERALLY POSTED STRONG GAINS IN 2022. HAVE I MISSED THE OPPORTUNITY?
Macro is designed to be a strategic, persistent allocation that adds value over a full market cycle (including bear and bull markets) and should not be timed. Rather than trading in-and-out of “winners,” investors are generally better served by constructing a well-diversified portfolio of low-correlated strategies with a long-term horizon.
WHAT IS THE OPPORTUNITY SET FOR MACRO LOOKING FORWARD?
Current macroeconomic conditions represent a sea change to the previous decade of quantitative easing, when every macro shock was met with an accommodative monetary policy response. This created the backdrop to the phenomenal performance for “beta” that we had until recently. However, inflation currently presents a unique challenge as instead of responding to downside risks with more accommodation, central banks need to tighten financial conditions even in the face of weak risk assets, effectively turning from shock absorbing to shock amplifying. We believe these conditions will be with us for a while, and that the next chapter will be an interesting and fertile ground for macro trading strategies.
WHAT IF MARKETS REVERSE COURSE?
Given the unpredictable nature of global events, it’s reasonable to ask how macro strategies might fare under a reversal of market moves. Fortunately, the tactical nature of macro strategies and the diverse, generally liquid market universe allow flexibility in trading evolving market themes. At its core, macro is a dynamic and tactical strategy that can adapt to a variety of market conditions. The strategy is not reliant on either economic growth or contraction, inflationary or deflationary environments, or bullish or bearish equity markets, to name a few scenarios. If any or none of these circumstances emerge, the strategy is expected to continue to add value to a diversified investment portfolio over the long-run. And, as market conditions continually change and market uncertainty is high, the best way to construct a portfolio resilient to changing market regimes is through proper diversification, active risk management, and thoughtful portfolio construction. Market correlations can be concentrated at times, as seen in 2022, and allocating to strategies with low correlation to stocks and bonds that have the ability to go long and short a variety of asset classes will be important to managing risk going forward.
IS AN EQUITY DRAWDOWN THE WRONG TIME TO MITIGATE RISK?
Equity cycles are notoriously difficult to predict. Some equity crises are short and sharp with intramonth recovery periods, whereas others are protracted and can take years to recover. As macroeconomic events continue to transpire, the range of potential market outcomes remains wide, and the spectrum of risk to which an investor is exposed is greater than ever. There is also reason to believe that the next “upcycle” for stocks and bonds may be more modest going forward. The decade preceding 2022 stands out as a particularly lucrative time for the 60/40 portfolio, particularly when looking at the returns in the context of a longer history. However, inflation can weigh on stocks and bonds when combined with hawkish monetary policy. As the macroeconomic paradigm shifts, many investors are shifting away from the long-only beta that disproportionately dominated portfolios throughout so many years of stability. It will be paramount for investors to allocate to strategies that can perform well in volatile environments and that add to the overall alpha and diversification characteristics of a portfolio.
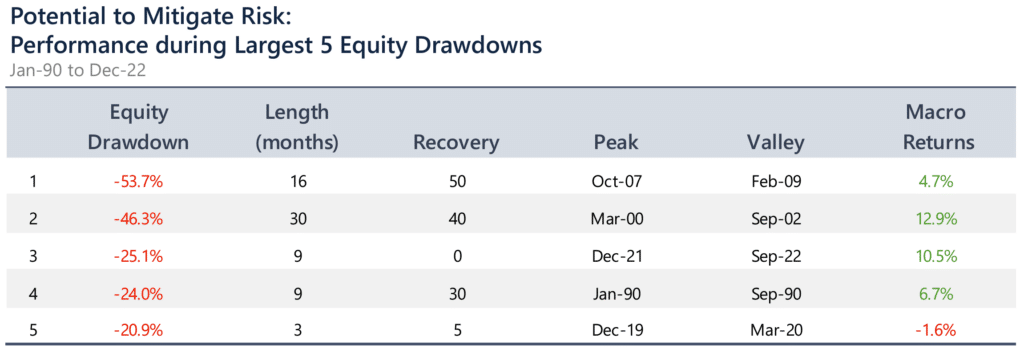
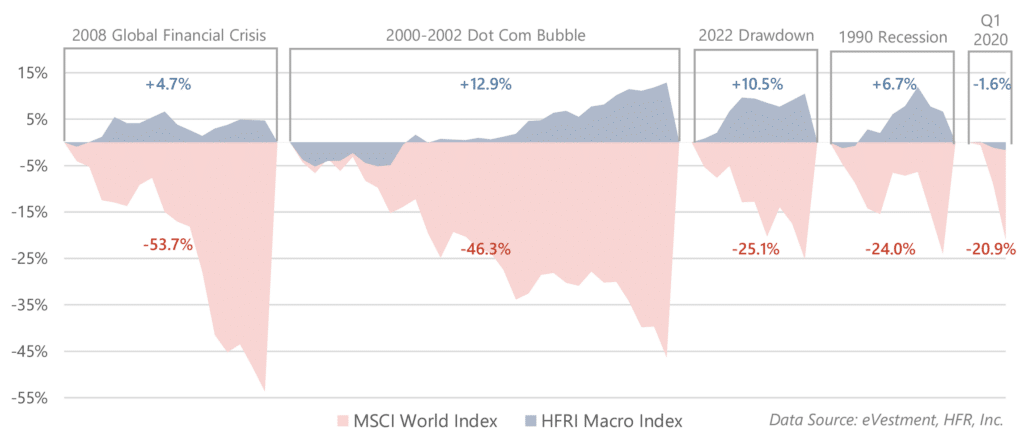
HOW DOES MACRO PERFORM DURING EQUITY DRAWDOWNS?
Macro strategies do not have an embedded bias to be long or short any given asset class, including equities. Over the longer term, macro tends to have low correlation to equities, providing the potential to perform well during periods of sustained stress in global equity markets. While macro has historically performed well, on average, during equity sell-offs, positive performance during equity downturns is not guaranteed and macro should not be treated exclusively as a portfolio hedge. For example, while macro was a good hedge during longer-term market declines such as the burst of the technology bubble, the 2008 Global Financial Crisis, and the 2022 equity market drawdown, sharp reversals and short-term declines can be challenging, as seen in Q1 2020.
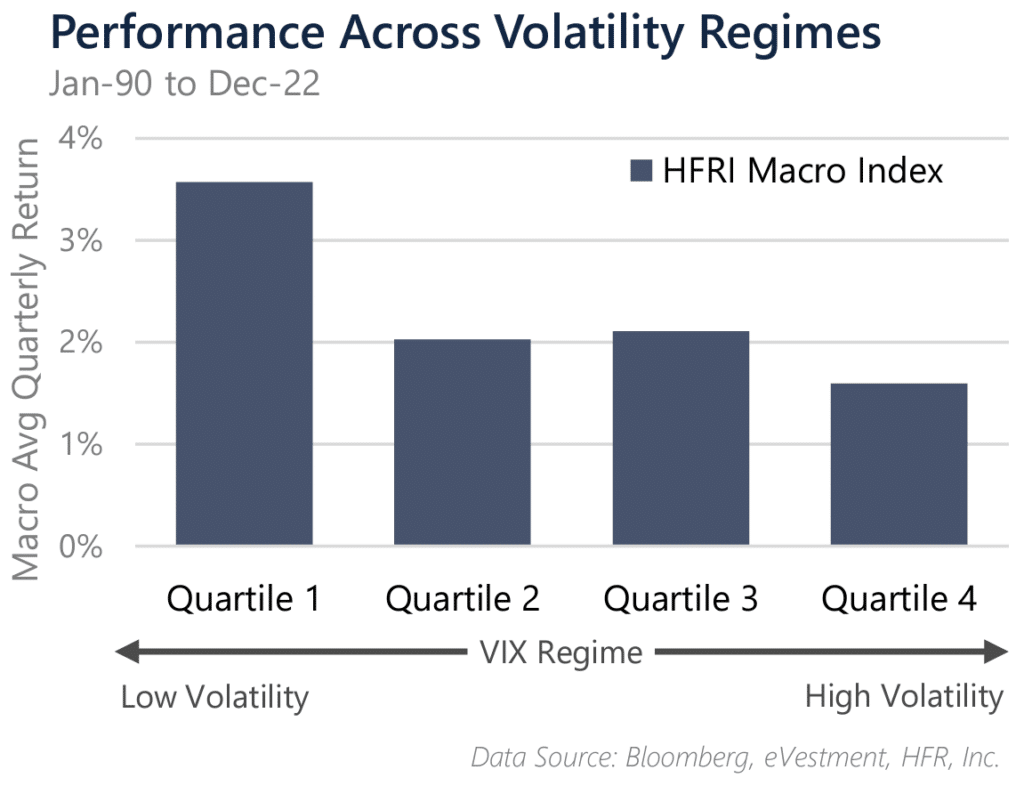
WHAT’S VOL GOT TO DO WITH IT?
Prior to March 2020, markets experienced a long period of low-volatility, which many believe dampened the opportunity set for macro strategies. Many see market volatility as a barometer for macro strategies’ success. Macro returns are closely linked to directional volatility due to expansions of ranges and price movement into new areas. For this reason, it is true that macro can thrive in periods of high market volatility. However, it should be noted that the strategy can perform well in low volatility regimes as well, as shown here. Macro returns strongly correspond to sustained directional moves in markets. Macro performs well during periods of strong market directionality (often when there is a clear catalyst for market shifts). Shorter-term market volatility that often results in choppy, range-bound markets can be more challenging for the strategy. While we cannot predict the level of directionality in markets in the coming years, we do anticipate several major macro catalysts which may create sustained directional opportunities in markets.
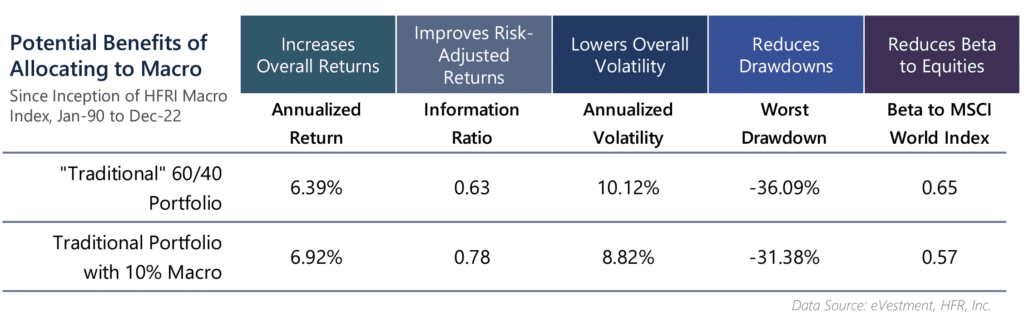
HOW CAN MACRO HELP WITH PORTFOLIO VOLATILITY?
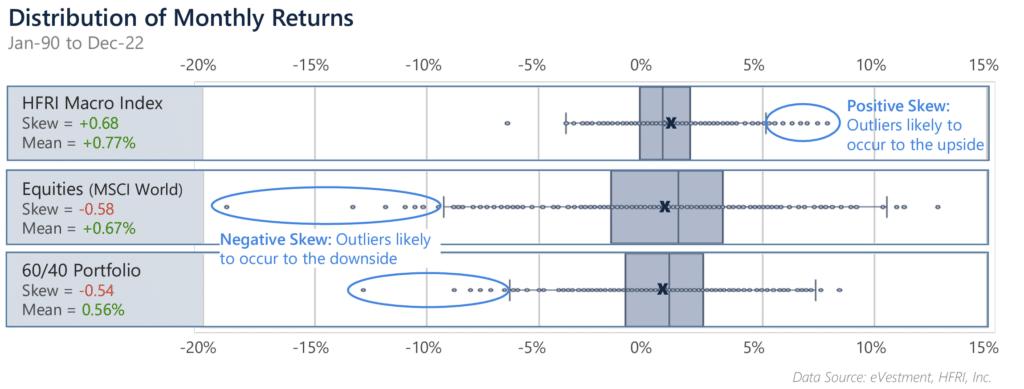
The diversification properties of macro strategies result in the potential to reduce overall volatility and drawdowns of a broader investment portfolio. Macro, in particular, tends to exhibit a positively skewed performance distribution. Positive skew is desirable because the strategy tends to exhibit more positive extremes than negative, with potentially many instances of smaller return periods in between. These positive extremes often occur when there are clear catalysts for directional market moves (which can be either bullish or bearish) and offer the potential to offset drawdowns elsewhere in a portfolio. In other words, macro can be a big contributor when the portfolio is under stress, and may not be a big drag during periods when the portfolio is performing well. This is true dynamic diversification.
IS MY BOND INVESTMENT ENOUGH TO PROVIDE DIVERSIFICATION AND REDUCE VOLATILITY?
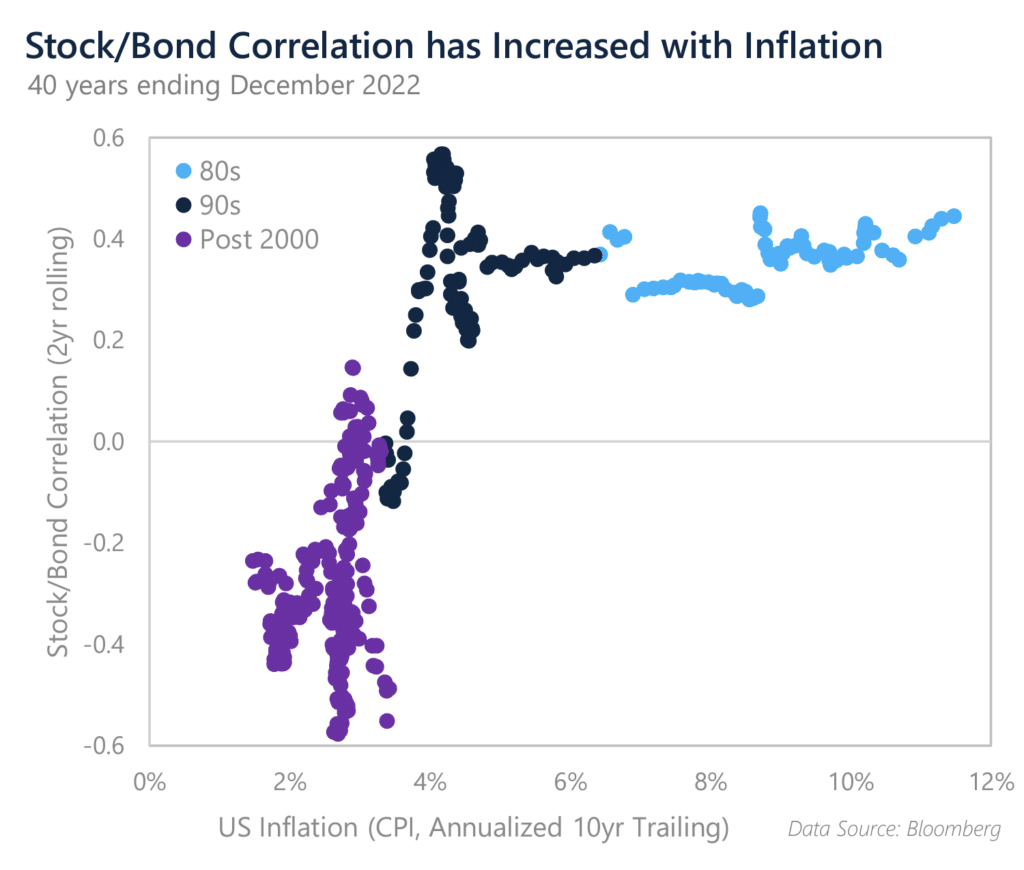
Long held as a staple for equity risk mitigation, bonds were unable to provide the greatly anticipated diversification benefits in 2022 as they declined in tandem with equities. Equity/bond relationships are not static, and there have been extended periods of positive stock/bond correlation. Today, the protective character of bonds is in jeopardy and investors may see positive correlations between stocks and bonds.
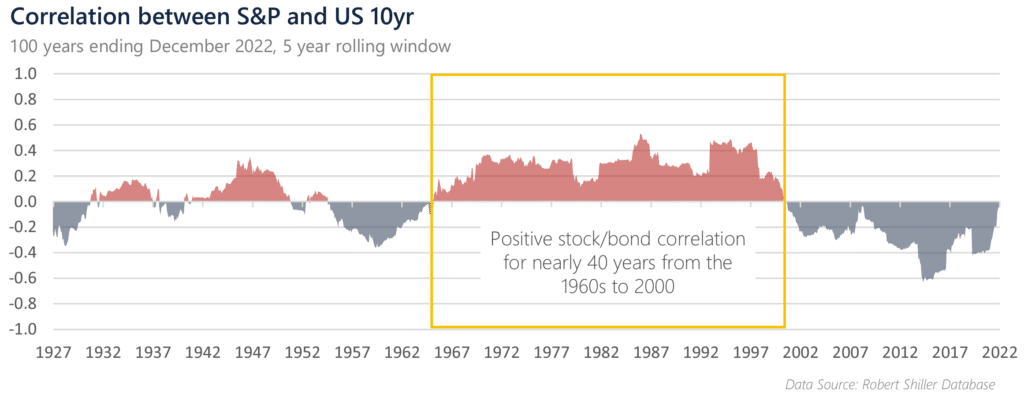
Elevated inflation presents a significant risk to stock/bond portfolios in terms of asset valuation, erosion of real returns, and positive correlation. When inflation rises, real yields decline alongside the market price of bonds, driving stock/bond correlations up.
As inflation persists in tandem with monetary tightening, bond investors may see lower returns and elevated volatility, decreasing bond utility as a “safe haven.”
HOW DOES MACRO PERFORM IN AN INFLATIONARY ENVIRONMENT?
Macro strategies can perform well in inflationary or non-inflationary regimes and can capitalize on increasing commodity prices during inflationary periods. At its core, global macro is a dynamic and tactical strategy that can adapt to a variety of market conditions and can flourish at times of big dislocations. For example, macro managers were broadly successful in the 2022 inflationary market environment, as they were able to capitalize on strong market directionality and fundamental catalysts.
MY HEDGE FUND INVESTMENT DIDN’T WORK OUT AS EXPECTED IN 2008 – HOW IS MACRO DIFFERENT?
Many investors seek diversification through alternative strategies. However, not all alternatives provide the expected portfolio diversification benefits. Diversification benefits vary significantly across styles, and many strategies have positive correlation during equity down markets. Macro is an uncorrelated, diversifying strategy that is also designed to act as an alpha component. Irrespective of the economic cycle, the strategy can participate in market rallies and also perform well in falling markets, including equity stress periods.
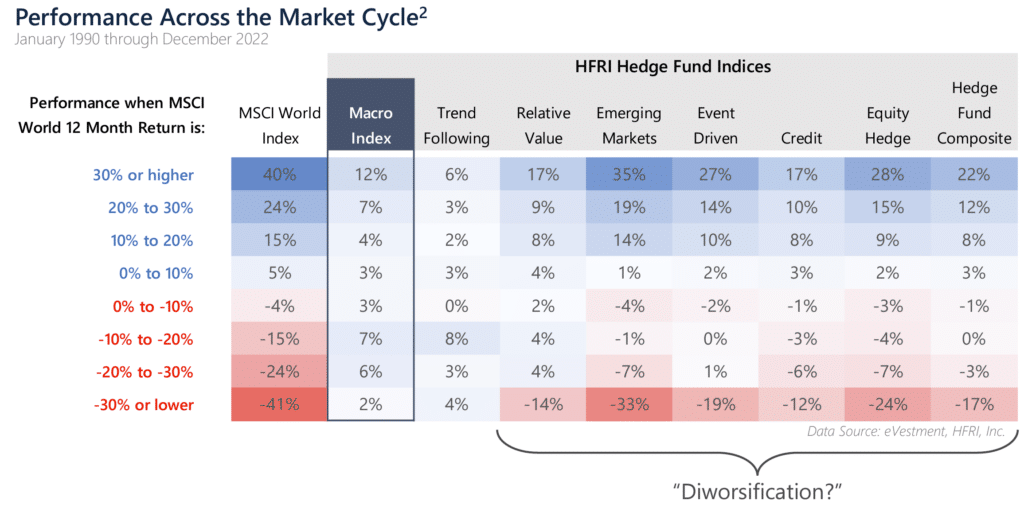
Data is presented from inception in January 1990 with the exception of the Credit and Trend Following indices, which are available from January 2008. PAST PERFORMANCE IS NOT NECESSARILY INDICATIVE OF FUTURE RESULTS. DISCLOSURES AT THE END OF THIS DOCUMENT ARE AN INTEGRAL PART OF THIS DOCUMENT.
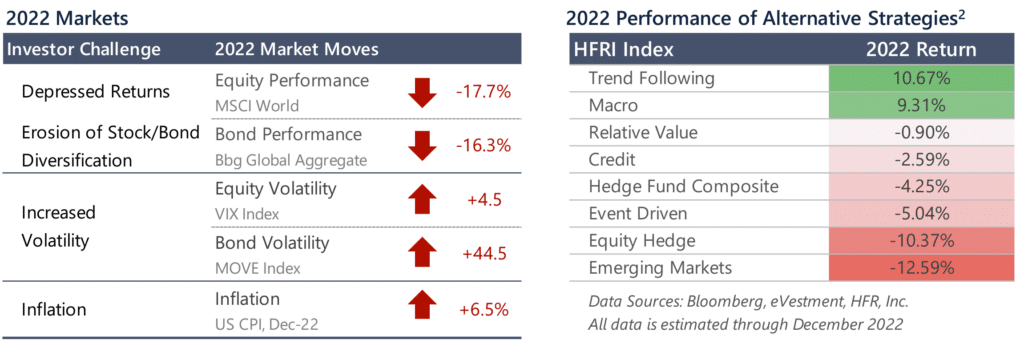
2022 CASE STUDY
In 2022, markets experienced a trifecta of a selloff in equity and bond markets, elevated inflation, and increased market volatility, making it a difficult year for many investors. Amid the resultant dispersion in alternative investment styles, global macro and trend-following strategies emerged as notable winners in 2022.
THE BOTTOM LINE
While we believe that the opportunity set for macro strategies will continue to be strong, it is important to maintain a long-term perspective relative to portfolio objectives and expectations. Allocating to strategies that have low correlation to equities and bonds can be a valuable portfolio construction tool with the potential to lower the volatility and dampen the drawdowns of an overall portfolio while adding to returns over the long run. These strategies are meant to complement – rather than compete with – traditional investments. And while no single strategy performs well at every discrete point in time, holding diversifying alternatives as a long-term, strategic allocation in a broad investment portfolio offers the potential for significant benefits over time.
IMPORTANT DISCLOSURE
REFERENCES
1 60/40 Returns reflects the annualized returns of a portfolio with a 60% allocation to equities and a 40% allocation to bonds as represented by the MSCI World Index and the Bloomberg Global Bond Index, respectively, rebalanced monthly. Real returns reflects the excess returns over inflation, as represented by U.S. CPI (Non Seasonally-Adjusted).
2 Alternative strategies are represented by their respective HFRI indices. For purposes of this presentation, we show broad hedge fund indices as categorized by HFRI, but our selection is not meant to be an exhaustive representation of all potential alternatives. Other investment strategies, including private equity, real estate, and venture capital, among others, are often considered to be diversifiers to traditional stock and bond portfolios but are not shown here due to limitations on the availability of a representative index or other constraints or considerations.
LEGAL DISCLAIMER
Source of data: Graham Capital Management (“Graham”), unless otherwise stated
This document is neither an offer to sell nor a solicitation of any offer to buy shares in any fund managed by Graham and should not be relied on in making any investment decision. Any offering is made only pursuant to the relevant prospectus, together with the current financial statements of the relevant fund and the relevant subscription documents all of which must be read in their entirety. No offer to purchase shares will be made or accepted prior to receipt by the offeree of these documents and the completion of all appropriate documentation. The shares have not and will not be registered for sale, and there will be no public offering of the shares. No offer to sell (or solicitation of an offer to buy) will be made in any jurisdiction in which such offer or solicitation would be unlawful. No representation is given that any statements made in this document are correct or that objectives will be achieved. This document may contain opinions of Graham and such opinions are subject to change without notice. Information provided about positions, if any, and attributable performance is intended to provide a balanced commentary, with examples of both profitable and loss-making positions, however this cannot be guaranteed.
It should not be assumed that investments that are described herein will be profitable. Nothing described herein is intended to imply that an investment in the fund is safe, conservative, risk free or risk averse. An investment in funds managed by Graham entails substantial risks and a prospective investor should carefully consider the summary of risk factors included in the Private Offering Memorandum entitled “Risk Factors” in determining whether an investment in the Fund is suitable. This investment does not consider the specific investment objective, financial situation or particular needs of any investor and an investment in the funds managed by Graham is not suitable for all investors. Prospective investors should not rely upon this document for tax, accounting or legal advice. Prospective investors should consult their own tax, legal accounting or other advisors about the issues discussed herein. Investors are also reminded that past performance should not be seen as an indication of future performance and that they might not get back the amount that they originally invested. The price of shares of the funds managed by Graham can go down as well as up and be affected by changes in rates of exchange. No recommendation is made positive or otherwise regarding individual securities mentioned herein.
This presentation includes statements that may constitute forward-looking statements. These statements may be identified by words such as “expects,” “looks forward to,” “anticipates,” “intends,” “plans,” “believes,” “seeks,” estimates,” “will,” “project” or words of similar meaning. In addition, our representatives may from time to time make oral forward-looking statements. Such statements are based on the current expectations and certain assumptions of GCM’s management, and are, therefore, subject to certain risks and uncertainties. A variety of factors, many of which are beyond GCM’s control, affect the operations, performance, business strategy and results of the accounts that it manages and could cause the actual results, performance or achievements of such accounts to be materially different from any future results, performance or achievements that may be expressed or implied by such forward-looking statements or anticipated on the basis of historical trends.
Tables, charts and commentary contained in this document have been prepared on a best efforts basis by Graham using sources it believes to be reliable although it does not guarantee the accuracy of the information on account of possible errors or omissions in the constituent data or calculations. No part of this document may be divulged to any other person, distributed, resold and/or reproduced without the prior written permission of Graham.
INDEX DISCLOSURE
The below are widely used indices that have been selected for comparison purposes only. Indices are unmanaged, and one cannot invest directly in an index. Except for HFR indices, which do reflect fees and expenses, the indices do not reflect any fees, expenses or sales charges. Unlike most asset class indices, hedge fund indices included in this presentation have limitations, which should be considered in connection with their use in this presentation. These limitations include survivorship bias (the returns of the indices may not be representative of all the hedge funds in the universe because of the tendency of lower performing funds to leave the index); heterogeneity (not all hedge funds are alike or comparable to one another, and the index may not accurately reflect the performance of a described style); and limited data (many hedge funds do not report to indices, and the index may omit funds which could significantly affect the performance shown; these indices are based on information self-reported by hedge fund managers which may decide at any time whether or not they want to continue to provide information to the index). These indices may not be complete or accurate representations of the hedge fund universe, and may be affected by the biases described above.
BLOOMBERG GLOBAL BOND INDEX: The Bloomberg Global Aggregate Bond Index is a broad-based market capitalization weighted measure of the global investment grade fixed-rate debt markets. This multi-currency benchmark includes treasury, government-related, corporate and securitized fixed- rate bonds from both developed and emerging markets issuers. There are four regional aggregate benchmarks that largely comprise the Global Aggregate Index: The US Aggregate, the Pan-European Aggregate, the Asian-Pacific Aggregate and the Canadian Aggregate Indices. The Global Aggregate Index also includes Eurodollar, Euro-Yen, and 144A Index-eligible securities, and debt from five local currency markets not tracked by the regional aggregate benchmarks (CLP, MXN, ZAR, ILS and TRY).
HFRI MACRO INDEX: The HFRI Macro Index is a sub-index of the HFRI Fund Weighted Composite Index and is composite index of over 900 Investment Managers which trade a broad range of strategies in which the investment process is predicated on movements in underlying economic variables and the impact these have on equity, fixed income, hard currency and commodity markets.
HFRI TREND FOLLOWING DIRECTIONAL INDEX: The HFRI Trend Following Directional Index is a global, equal-weighted index of single-manager funds that report to the HFR Database. The HFRI Trend Following Directional Index is comprised of funds that employ trend following strategies such as Macro: Currency – Systematic, Macro: Systematic Diversified, certain Macro: Multi-Strategy funds and other Macro funds that utilize, to some degree, trend following.
HFRI RELATIVE VALUE INDEX: Investment Managers who maintain positions in which the investment thesis is predicated on realization of a valuation discrepancy in the relationship between multiple securities. Managers employ a variety of fundamental and quantitative techniques to establish investment theses, and security types range broadly across equity, fixed income, derivative or other security types. Fixed income strategies are typically quantitatively driven to measure the existing relationship between instruments and, in some cases, identify attractive positions in which the risk adjusted spread between these instruments represents an attractive opportunity for the investment manager. RV position may be involved in corporate transactions also, but as opposed to ED exposures, the investment thesis is predicated on realization of a pricing discrepancy between related securities, as opposed to the outcome of the corporate transaction.
HFRI EMERGING MARKETS INDEX: Emerging Markets funds invest, primarily long, in securities of companies or the sovereign debt of developing or ’emerging’ countries. Emerging Markets regions include Africa, Asia ex-Japan, Latin America, the Middle East and Russia/Eastern Europe. Emerging Markets – Global funds will shift their weightings among these regions according to market conditions and manager perspectives.
HFRI EVENT DRIVEN INDEX: Investment Managers who maintain positions in companies currently or prospectively involved in corporate transactions of a wide variety including but not limited to mergers, restructurings, financial distress, tender offers, shareholder buybacks, debt exchanges, security issuance or other capital structure adjustments. Security types can range from most senior in the capital structure to most junior or subordinated, and frequently involve additional derivative securities. Event Driven exposure includes a combination of sensitivities to equity markets, credit markets and idiosyncratic, company specific developments. Investment theses are typically predicated on fundamental characteristics (as opposed to quantitative), with the realization of the thesis predicated on a specific development exogenous to the existing capital structure.
HFRI CREDIT INDEX: HFRI Credit Index is a composite index of strategies trading primarily in credit markets. It is an aggregation of following 7 HFRI substrategy indices. HFRI ED: Credit Arbitrage Index, HFRI ED: Distressed/Restructuring Index, HFRI ED: Multi-Strategy Index, HFRI RV: Fixed Income- Asset Backed Index, HFRI RV: Fixed Income-Convertible Arbitrage Index, HFRI RV: Fixed Income-Corporate Index, and HFRI RV: Multi-Strategy Index.
HFRI EQUITY HEDGE INDEX: Investment Managers who maintain positions both long and short in primarily equity and equity derivative securities. A wide variety of investment processes can be employed to arrive at an investment decision, including both quantitative and fundamental techniques; strategies can be broadly diversified or narrowly focused on specific sectors and can range broadly in terms of levels of net exposure, leverage employed, holding period, concentrations of market capitalizations and valuation ranges of typical portfolios. EH managers would typically maintain at least 50% exposure to, and may in some cases be entirely invested in, equities, both long and short.
HFRI COMPOSITE INDEX: The HFRI Fund Weighted Composite Index is a global, equal-weighted index of single-manager funds that report to HFR Database. Constituent funds report monthly net of all fees performance in US Dollar and have a minimum of $50 Million under management or $10 Million under management and a twelve (12) month track record of active performance. The HFRI Fund Weighted Composite Index does not include Funds of Hedge Funds.
MSCI WORLD INDEX: A market cap weighted stock market index of 1,652 global stocks and is used as a common benchmark for ‘world’ or ‘global’ stock funds. The index includes a collection of stocks of all the developed markets in the world, as defined by MSCI. The index includes securities from 23 countries but excludes stocks from emerging and frontier economies.
S&P 500 TOTAL RETURN INDEX: An unmanaged, market value-weighted index measuring the performance of 500 U.S. stocks chosen for market size, liquidity, and industry group representation. Includes the reinvestment of dividends. The S&P 500 index components and their weightings are determined by S&P Dow Jones Indices.
Traditional 60/40 Portfolio: Reflects a portfolio with a 60% allocation to equities and a 40% allocation to bonds as represented by the MSCI World Index and the Bloomberg Global Bond Index, respectively, rebalanced monthly.
Traditional Portfolio with 10% Macro: Reflects a portfolio with a 56% allocation to equities, 36% allocation to bonds, and 10% allocation to macro, as represented by the MSCI World Index, Bloomberg Global Bond Index, and the HFRI Macro (Total) Index, respectively, rebalanced monthly.
Stocks and bonds are represented by the MSCI World Index and the Bloomberg Global Aggregate Index, respectively, unless otherwise noted.
