Easing, Tightening, and Everything in Between:
The Role of Macro Strategies across Monetary Policy Regimes
Shifts in central bank policies often mark new market phases, though predicting these inflection points is notoriously challenging. As economic priorities evolve, central banks must carefully balance growth, labor markets, and inflation—easing rates enough to support growth without reigniting inflation. Amid these transitions, macro hedge funds play a unique role in diversifying risk within investment portfolios, particularly during periods of economic uncertainty. This analysis examines how macro strategies have historically performed across various monetary policy environments and explores the implications for traditional stock and bond portfolios.
MONETARY POLICY AS A CATALYST FOR MACRO STRATEGIES
At its core, global macro is a comprehensive strategy designed to capitalize on the effects of economic and geopolitical developments on global markets. By analyzing the impact of macroeconomic variables on interest rates, currencies, commodities, credit, and equities, global macro managers seek to position their portfolios to profit from both anticipated and unexpected shifts in the global landscape.
Monetary policy, deeply intertwined with economic fundamentals, often creates opportunities for macro strategies by driving directional price moves, market volatility, and dislocations. Historically, changes in policy rates have shown a positive relationship with the alpha generated by macro hedge funds, as illustrated below. This alpha arises not only from the policy shifts themselves but also from the economic catalysts that compel central banks to act.
Macro Alpha Increases with Monetary Policy Activity
Jan-90 to Dec-24
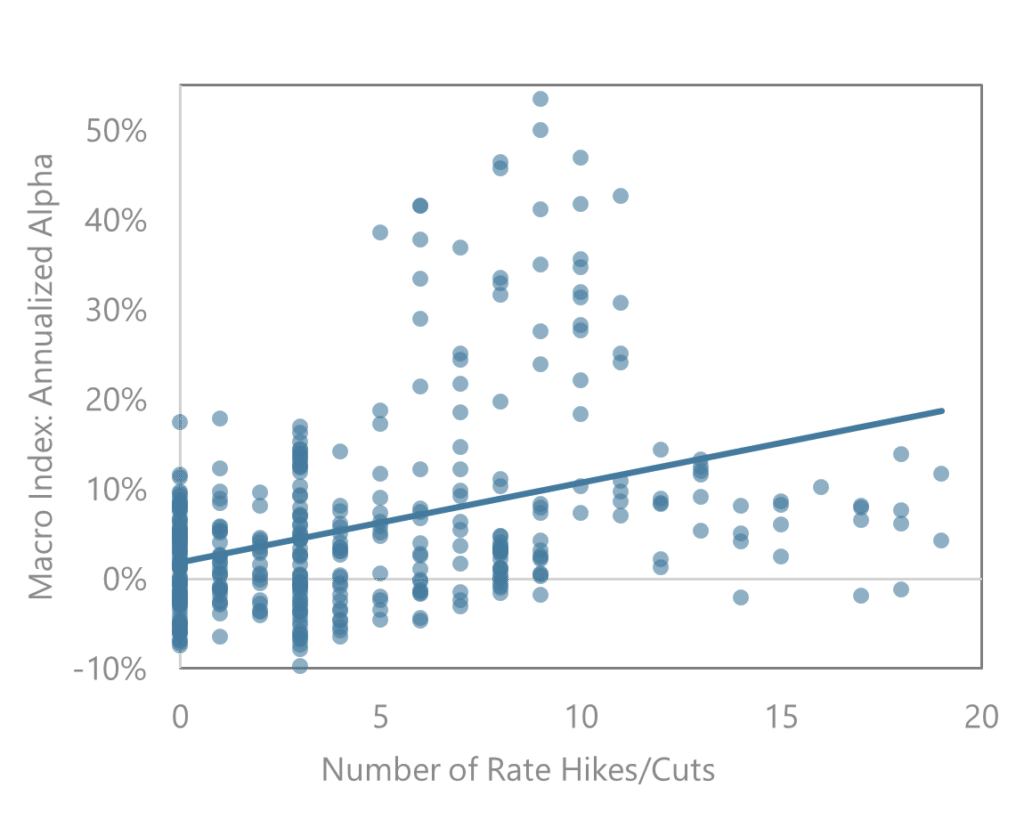
The trendline above shows a positive relationship between macro alpha generation and the frequency and magnitude of rate hikes/cuts. This is represented as the HFRI Macro (Total) Index’s annualized alpha over a global 60/40 portfolio plotted alongside the number of 25bp equivalent changes in the target rate over 12 month rolling periods. We use the Federal Reserve target rate, given its significant influence in shaping global central bank actions.
Additionally, the dispersion of G10 front-end rates, a proxy for global monetary policy divergence, has similarly shown a positive relationship with macro alpha generation, as shown below. When central banks adopt differing stances, it creates disparities in interest rates and economic outlooks across regions. These divergences can lead to substantial shifts in currency valuations, capital flows, and asset prices, creating trading opportunities for macro managers.
Macro Alpha Increases with Monetary Policy Dispersion1
Jan-00 to Dec-24
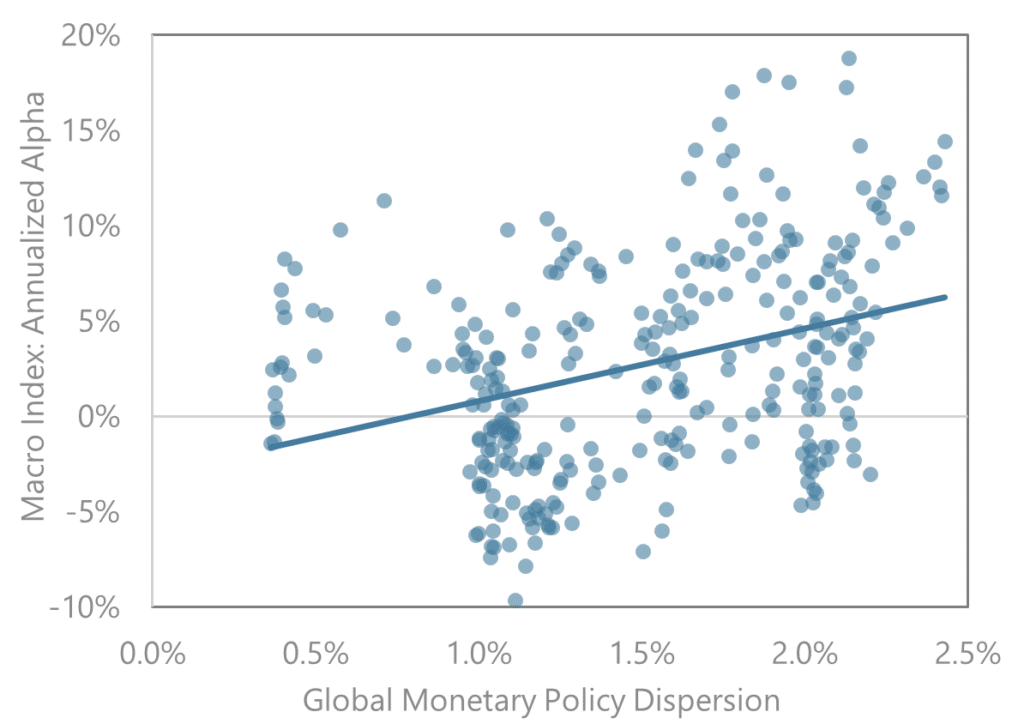
The trendline above shows a positive relationship between macro alpha generation and global monetary policy dispersion. This is represented as the HFRI Macro (Total) Index’s annualized alpha over a global 60/40 portfolio plotted alongside the cross-sectional standard deviation of rates within G10 countries, as represented by 1 year swap rates, over 12 month rolling periods.
This analysis explores how macro has historically performed across different monetary policy regimes. Importantly, as a multi-variate strategy with a wide range of trading drivers, the success of macro trading strategies is only captured after careful consideration of each regime’s unique economic dynamics. We see that macro strategies can adapt to evolving economic variables, often providing diversification to a broader portfolio when it is needed most.
DISSECTING PERFORMANCE ACROSS RATE REGIMES
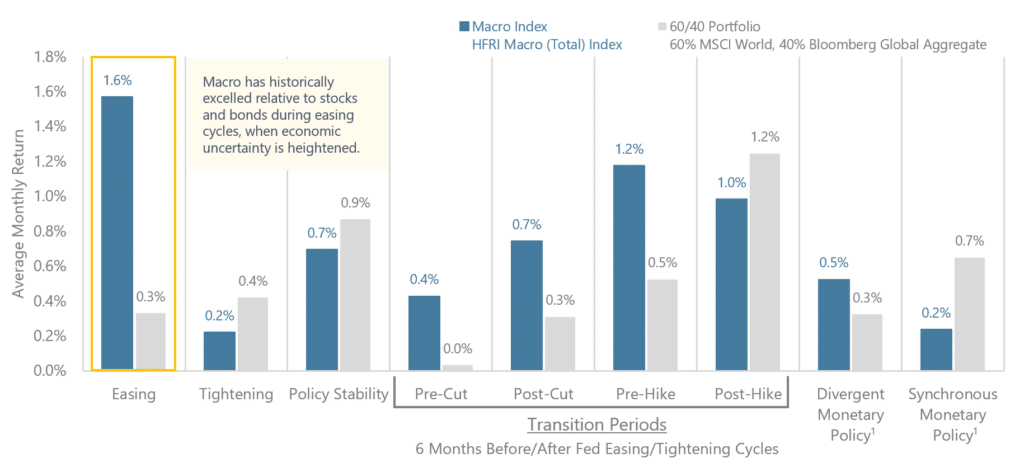
The chart below compares average monthly returns of macro hedge funds and a 60/40 portfolio across different monetary policy regimes. A high-level view of these regimes shows that macro strategies have historically delivered positive returns in various environments—whether easing, tightening, or transitions in between. Notably, macro has outperformed traditional assets during monetary easing cycles, when central banks cut rates in response to crises or fragile economic conditions. This highlights macro managers’ ability to capitalize on dislocations when diversification is most critical.
While traditional assets also generate positive returns across cycles, the details of each regime reveal greater downside volatility for these assets, underscoring macro’s complementary role in portfolios. Importantly, performance is influenced not only by monetary policy shifts but also by the broader macroeconomic landscape, with key insights often found in the nuances of each regime.
Macro Returns Across Monetary Policy Regimes
January 1990 to December 2024
At a Glance
Easing Cycles
Macro strategies provide resilience and diversification during periods of economic stress, as central banks cut rates to stabilize economies.
Tightening Cycles
Hawkish policies weigh on financial markets, leading to subdued returns for many assets. Macro typically delivers positive, albeit modest, performance on average.
Policy Stability
During stable policy periods, equities historically outperformed, while macro funds delivered steady returns albeit with fewer directional trade opportunities.
Policy Transition Periods
Periods of policy uncertainty have historically created opportunities for macro strategies, which can tactically adjust to offset stock and bond volatility.
Periods of Central Bank Divergence
In periods of divergent monetary policies, macro strategies can capitalize on disparities in interest rates and regional economic outlooks.
EASING CYCLES
Easing cycles typically emerge during periods of economic stress, characterized by slowing growth, rising unemployment, or systemic financial crises. Central banks cut rates and deploy liquidity to ensure sustainable achievement of their price stability or full employment objectives. While such policy responses buoy risk assets like stocks, the underlying fragility of the economy often tempers gains. Bonds may benefit initially as yields decline, but their upside potential is capped in low-rate environments. Macro hedge funds have demonstrated resilience during easing cycles, often outperforming traditional 60/40 portfolios when central banks cut rates in response to crises. This highlights the defensive nature of macro strategies, which can thrive amidst a backdrop of a fragile economy, providing a complementary return stream to traditional investments.
Fed Easing Cycles
Average Monthly Returns
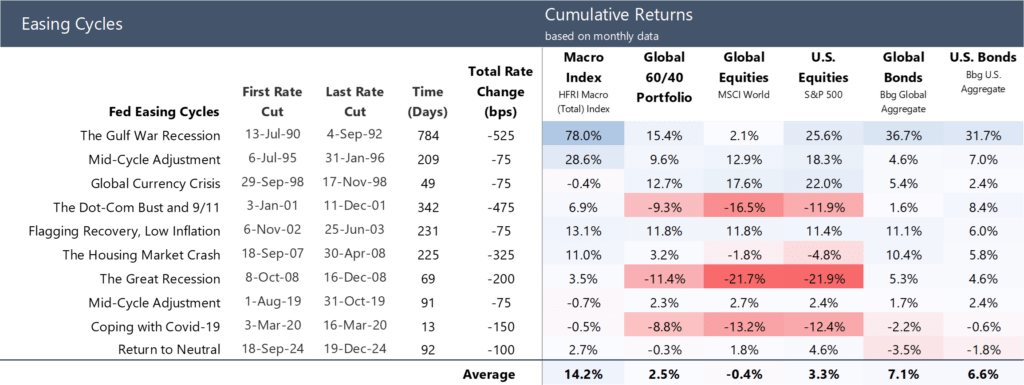
Early 2000s Dot-Com Bust and 9/11
The dot-com bubble burst, triggering a recession worsened by the 9/11 attacks. Equities collapsed, bonds outperformed as safe havens, and macro strategies navigated the volatility successfully. The Fed’s response — historically low interest rates — helped fuel a housing boom that later contributed to the 2008 financial crisis.
’07-’08 Housing Market Crash and GFC
The Fed’s first large-scale use of Quantitative Easing (QE) set a precedent for unconventional monetary policy. As the housing bubble burst and unemployment rose, the Fed slashed rates to zero and introduced QE to stabilize markets and the economy. Macro strategies capitalized on market dislocations, returning 11% in 2007 and 5% in 2008, while equities collapsed and U.S. bond prices rose. Though QE stabilized markets and lowered borrowing costs, it left lasting impacts, including prolonged ultra-low yields.
2020 Pandemic Response
This marked the fastest and most aggressive response to an economic crisis in Fed history, with additional tools like forward guidance. The Fed slashed rates to near zero in March 2020 and restarted QE to stabilize markets and support the economy during the COVID-19 pandemic. Equities plunged in March before rebounding quickly due to stimulus, bonds rallied as yields fell, and performance dispersion among macro funds increased as managers repositioned amidst the short and sharp reversal.
TIGHTENING CYCLES
Tightening cycles are typically introduced when inflationary pressures build or economies overheat. Historically, performance has been more muted across asset classes during tightening cycles. In equity markets, rising rates increase borrowing costs for corporations, suppressing profits and equity valuations. Bonds face similar headwinds, as higher yields erode the value of existing fixed-income securities. More importantly, as discussed in Macro-Economic-Drivers-of-the-Bond-Stock-Correlation (P. Calderini, August 2021), when stock market declines are driven by concerns about inflation or hawkish monetary policy, stocks and bonds may decline simultaneously, as we saw in 2022 when the 60/40 portfolio declined 17% on the year. Macro acts as an important diversifier during such periods.
Fed Hiking Cycles
Average Monthly Returns
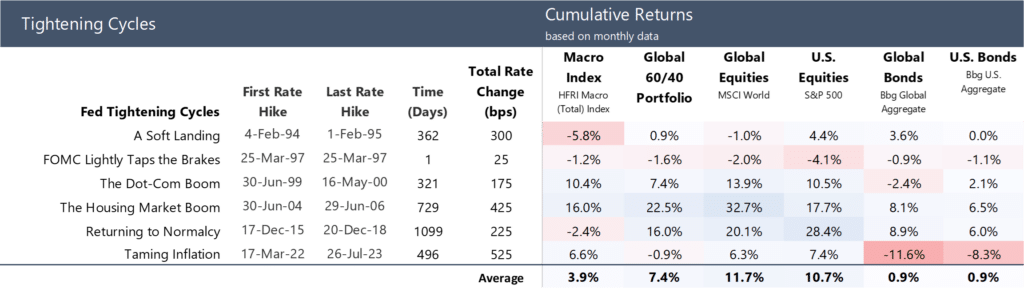
2022-2023 Post-Pandemic Inflation Control
The March 2022 to July 2023 tightening cycle represented an unprecedented speed of rate hikes in the modern era, alongside a reduction in the Fed’s balance sheet (quantitative tightening). In response to the highest inflation in 40 years, the Fed rapidly raised rates from near zero to over 5% within a year.
Equities experienced sharp volatility and sell-offs as the rapid rate hikes created uncertainty around economic growth and corporate earnings. In 2022, equities experienced their worst peak-to-trough drawdown since the 2008 Global Financial Crisis, with the MSCI World declining -25% at the trough, and the S&P 500 declining -24%. By late 2023, optimism around potential rate stabilization or cuts led to selective rallies, with markets pricing in a “soft landing.”
Bond prices declined as yields soared, with the 10-year U.S. Treasury yield rising to its highest levels in over a decade as investors demanded higher returns for longer-duration assets amid tighter monetary policy. The rapid pace of short-term rate hikes led to a significant inversion of the yield curve, often seen as a harbinger of economic slowdown or recession.
Macro strategies, meanwhile, returned 9% on the year (as represented by the HFRI Macro Index) by capitalizing on large moves in interest rates, currencies, and commodities, providing welcome diversification to the simultaneous stock/bond selloff.
PERIODS OF STABILITY
In prolonged periods of expansive, stable monetary policy with stable inflation, equities typically outperform as risk sentiment improves. In such environments, macro funds often perform steadily but may not see the same upside as equities. With fewer catalysts to drive macroeconomic dislocations, opportunities for significant directional trades in equities, rates, currencies, and commodities may be more limited. Nonetheless, on average, both traditional assets and macro strategies have historically posted positive returns during periods of economic stability.
Periods of Fed Inactivity
Average Monthly Returns, No Rate Changes in 6+ Months
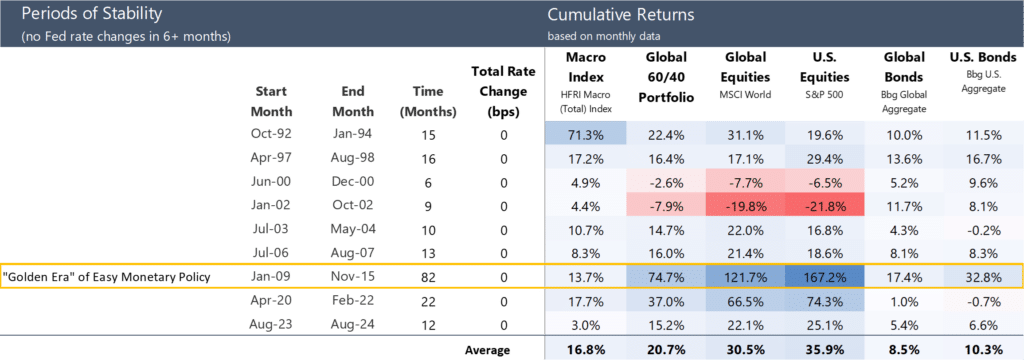
A “Golden Era” for Stocks and Bonds
The decade following the Great Recession was a “Golden Era” for stocks and bonds, characterized by prolonged near-zero interest rates. This period stood out not only for its accommodative monetary policy, including negative real rates in some countries, but also for the extended stretch of time with minimal central bank intervention, as highlighted in the table above. Equities thrived in this environment, experiencing a bull market fueled by cheap borrowing costs and abundant liquidity. Bonds also performed well, benefiting from central bank asset purchases, which supported bond prices. Meanwhile, macro strategies delivered positive, albeit more muted returns, as the low rate environment suppressed volatility and created range-bound markets.
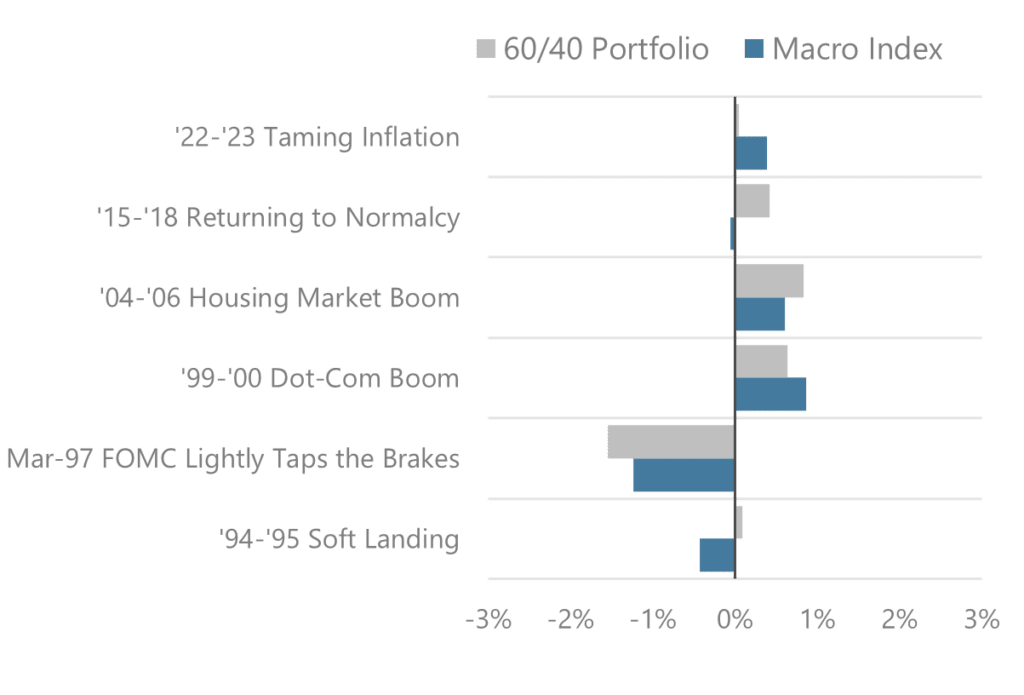
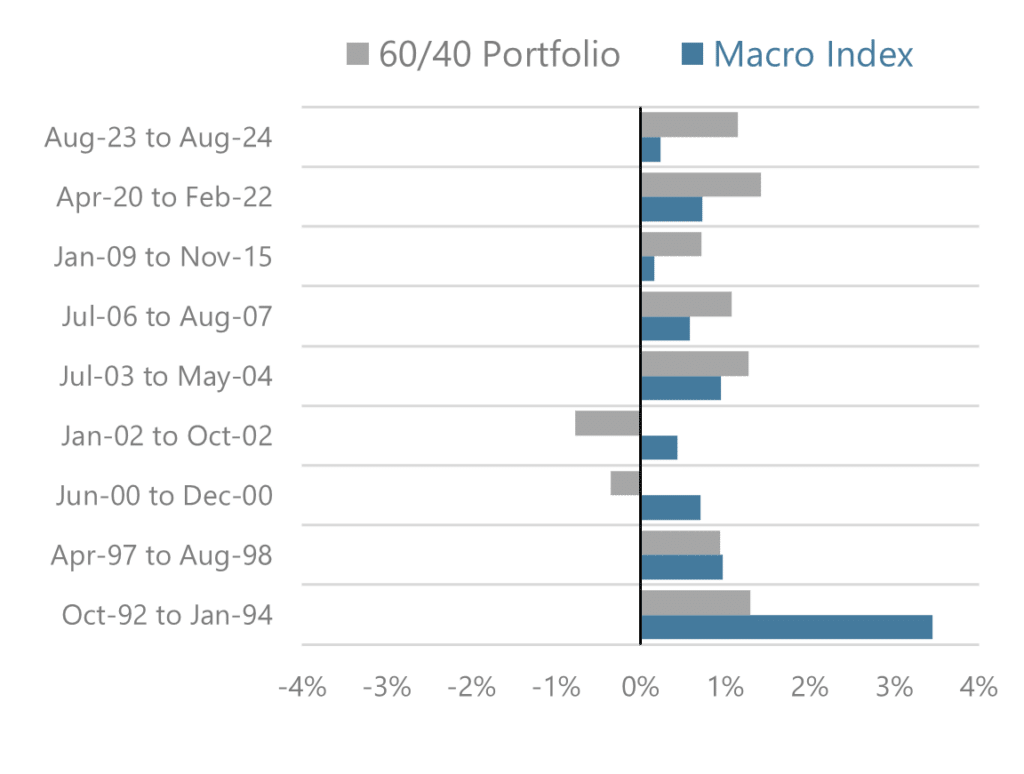
TRANSITION PERIODS
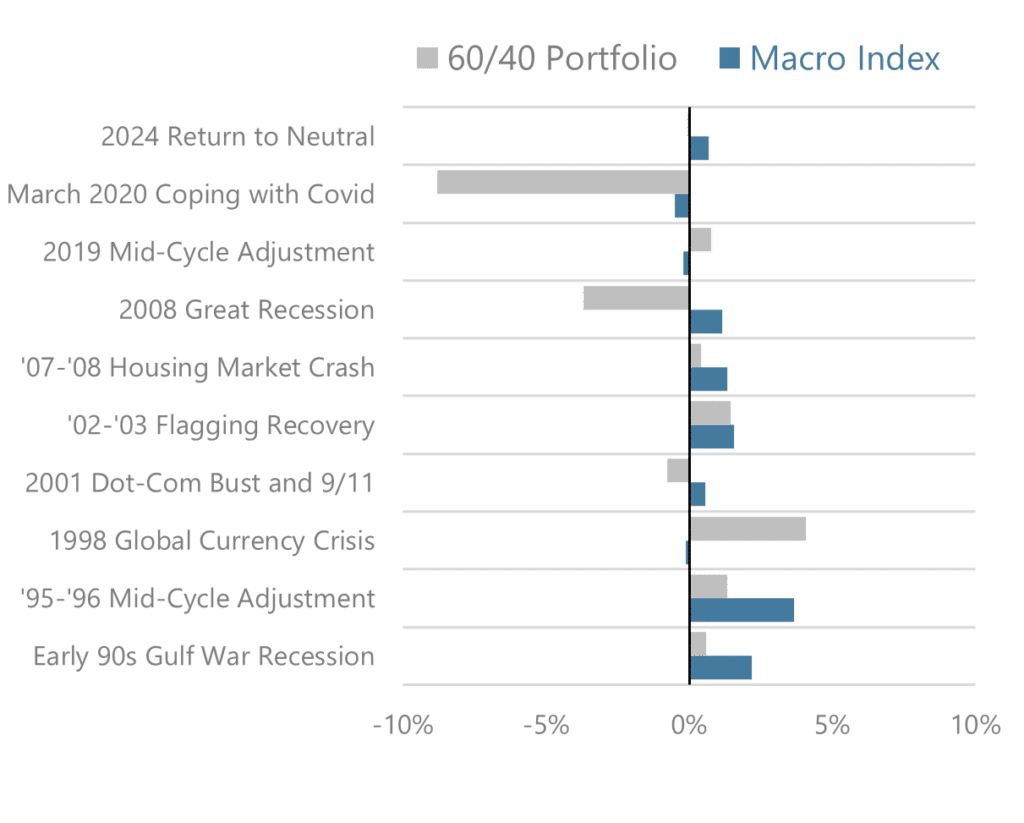
Periods of policy uncertainty often present opportunities for macro strategies. Traditional assets also have the potential to perform well, but with greater downside variability, as shown below. Notably, macro strategies offer the ability to offset poor performance for stocks and bonds during these periods. At their best, macro strategies are tactical and can dynamically adjust to changing markets situations rather than taking a sticky long-term position.
Cumulative Returns 6 Months Before/After Easing Cycles
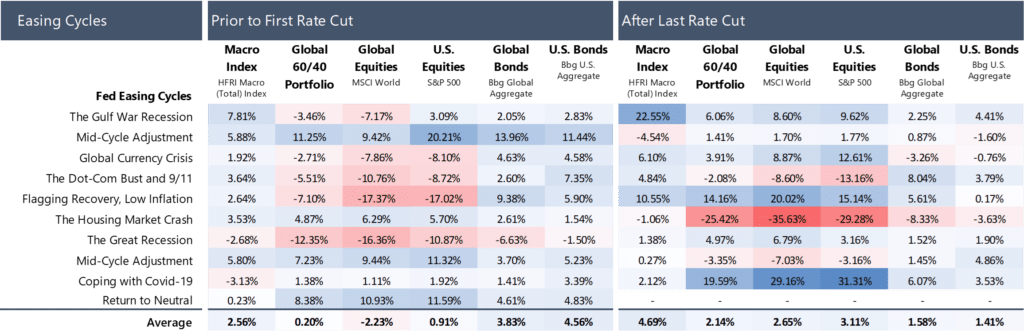
Cumulative Returns 6 Months Before/After Hiking Cycles
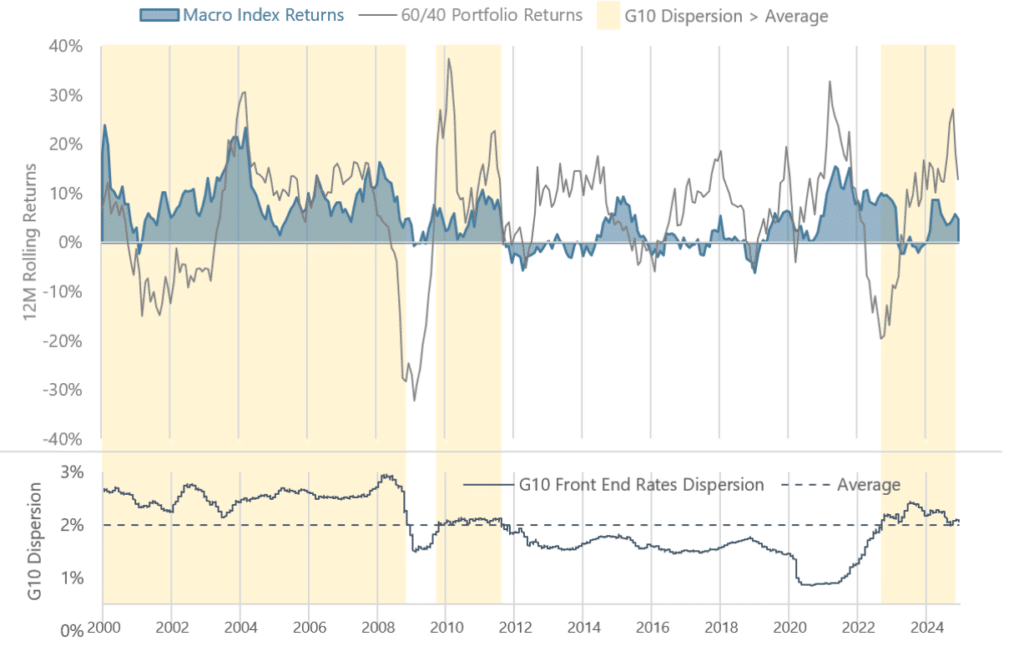
PERIODS OF CENTRAL BANK DIVERGENCE
As mentioned previously, when central banks adopt differing monetary policy stances, it creates disparities in interest rates and economic outlooks across regions. These divergences can lead to substantial shifts in currency valuations, capital flows, and asset prices, creating trading opportunities for macro managers. For example, central bank policies can inform currency carry trades, where macro managers borrow in low-interest-rate currencies to invest in higher-yielding assets.
In the chart below, G10 dispersion is defined as the cross-sectional standard deviation of rates within G10 countries. Here we use 1 year swap rates, which are generally considered to be sensitive to monetary policy expectations. We see that G10 dispersion declined sharply following a peak during the 2008 Global Financial Crisis. During the COVID-19 crisis in 2020, dispersion reached new lows as G10 central banks collectively infused liquidity into financial markets, coinciding with more subdued returns for macro strategies. However, the rise in dispersion starting in 2022 signaled a potential regime shift compared to much of the post-GFC period, with many macro managers capitalizing on the resulting directional trading opportunities in 2022 and beyond.
Macro Returns and G10 Rate Dispersion
January 2000 to December 2024
THE ROLE OF MACRO
Macro strategies excel in dynamic economic environments, including both easing and tightening cycles, as well as periods of transition marked by market volatility and dislocations. These strategies are particularly effective during heightened central bank intervention and economic uncertainty, with trading drivers that include monetary policy, inflation dynamics, and global economic divergence, among others. Conversely, in periods of low volatility and stable markets — often associated with policy normalization — macro opportunities are more muted as trends and inefficiencies become less pronounced.
Macro trading is inherently adaptive, driven by the analysis of diverse macroeconomic variables and their impact on global markets. Positions are dynamic, shifting with evolving themes over days or weeks. While monetary policy is a key driver, it operates within a broader, multivariate macroeconomic context. By offering low correlation to traditional asset classes, macro strategies enhance the resilience and diversification of a 60/40 portfolio, providing a critical edge in navigating complex financial landscapes.
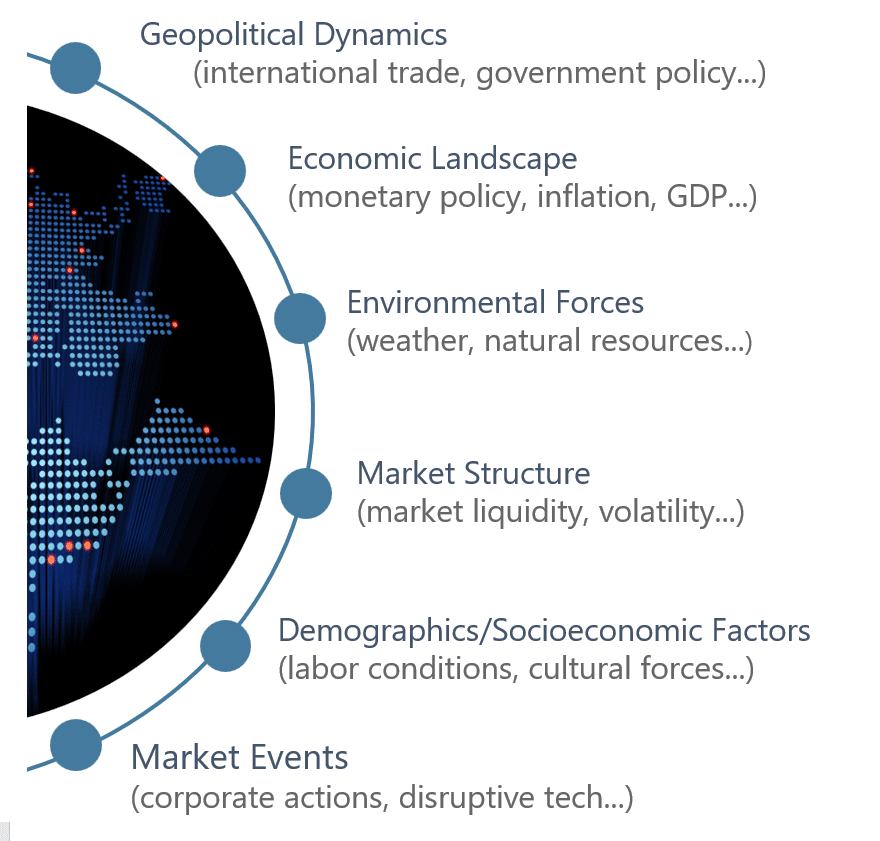
Macro Trading Drivers
IMPORTANT DISCLOSURE
SOURCES
1 G10 Monetary Policy is defined by the cross-sectional standard deviation (dispersion) of G10 1 year swap rates from January 2000 to September 2024. “Divergent” policy reflects periods when the dispersion is above the historical mean. Synchronous policy periods reflects periods when dispersion is below the historical mean. See also: Graham Capital Management, “Carry in Different Monetary Policy Regimes.” Graham Capital Management Quant Log, https://www.grahamcapital.com/quant-post/carry-in-different-monetary-policy-regimes/. Accessed 12/30/2024.
Rate regime category labels used in this analysis are based on historical classifications from Forbes Advisor. “Fed Funds Rate History: Its Highs, Lows and Everything In-Between.” Forbes, https://www.forbes.com/advisor/investing/fed-funds-rate-history/. Accessed 12/30/2024.
“Federal Funds Target Rate (Upper Limit) [DFEDTARU].” FRED, Federal Reserve Bank of St. Louis, Federal Reserve Bank of St. Louis, https://fred.stlouisfed.org/series/DFEDTARU. Accessed 12/30/2024.
“Federal Funds Target Rate (Lower Limit) [DFEDTAR].” FRED, Federal Reserve Bank of St. Louis, Federal Reserve Bank of St. Louis, https://fred.stlouisfed.org/series/DFEDTAR. Accessed 12/30/2024.
LEGAL DISCLAIMER
Source of data: Graham Capital Management (“Graham”), unless otherwise stated
This document is neither an offer to sell nor a solicitation of any offer to buy shares in any fund managed by Graham and should not be relied on in making any investment decision. Any offering is made only pursuant to the relevant prospectus, together with the current financial statements of the relevant fund and the relevant subscription documents all of which must be read in their entirety. No offer to purchase shares will be made or accepted prior to receipt by the offeree of these documents and the completion of all appropriate documentation. The shares have not and will not be registered for sale, and there will be no public offering of the shares. No offer to sell (or solicitation of an offer to buy) will be made in any jurisdiction in which such offer or solicitation would be unlawful. No representation is given that any statements made in this document are correct or that objectives will be achieved. This document may contain opinions of Graham, and such opinions are subject to change without notice. Information provided about positions, if any, and attributable performance is intended to provide a balanced commentary, with examples of both profitable and loss-making positions, however this cannot be guaranteed.
It should not be assumed that investments that are described herein will be profitable. Nothing described herein is intended to imply that an investment in the fund is safe, conservative, risk free or risk averse. An investment in funds managed by Graham entails substantial risks and a prospective investor should carefully consider the summary of risk factors included in the Private Offering Memorandum entitled “Risk Factors” in determining whether an investment in the Fund is suitable. This investment does not consider the specific investment objective, financial situation or particular needs of any investor and an investment in the funds managed by Graham is not suitable for all investors. Prospective investors should not rely upon this document for tax, accounting or legal advice. Prospective investors should consult their own tax, legal accounting or other advisors about the issues discussed herein. Investors are also reminded that past performance should not be seen as an indication of future performance and that they might not get back the amount that they originally invested. The price of shares of the funds managed by Graham can go down as well as up and be affected by changes in rates of exchange. No recommendation is made positive or otherwise regarding individual securities mentioned herein.
This presentation includes statements that may constitute forward-looking statements. These statements may be identified by words such as “expects,” “looks forward to,” “anticipates,” “intends,” “plans,” “believes,” “seeks,” “estimates,” “will,” “project” or words of similar meaning. In addition, our representatives may from time to time make oral forward-looking statements. Such statements are based on the current expectations and certain assumptions of Graham’s management, and are, therefore, subject to certain risks and uncertainties. A variety of factors, many of which are beyond Graham’s control, affect the operations, performance, business strategy and results of the accounts that it manages and could cause the actual results, performance or achievements of such accounts to be materially different from any future results, performance or achievements that may be expressed or implied by such forward-looking statements or anticipated on the basis of historical trends.
Tables, charts and commentary contained in this document have been prepared on a best-efforts basis by Graham using sources it believes to be reliable although it does not guarantee the accuracy of the information on account of possible errors or omissions in the constituent data or calculations. No part of this document may be divulged to any other person, distributed, resold and/or reproduced without the prior written permission of Graham.
INDEX DISCLOSURE
The below are widely used indices that have been selected for comparison purposes only. Indices are unmanaged, and one cannot invest directly in an index. Except for HFR indices, which do reflect fees and expenses, the indices do not reflect any fees, expenses or sales charges. Unlike most asset class indices, hedge fund indices included in this presentation have limitations, which should be considered in connection with their use in this presentation. These limitations include survivorship bias (the returns of the indices may not be representative of all the hedge funds in the universe because of the tendency of lower performing funds to leave the index); heterogeneity (not all hedge funds are alike or comparable to one another, and the index may not accurately reflect the performance of a described style); and limited data (many hedge funds do not report to indices, and the index may omit funds which could significantly affect the performance shown; these indices are based on information self-reported by hedge fund managers which may decide at any time whether or not they want to continue to provide information to the index). These indices may not be complete or accurate representations of the hedge fund universe and may be affected by the biases described above.
BLOOMBERG GLOBAL AGGREGATE INDEX: The Bloomberg Global Aggregate Index is a broad-based market capitalization weighted measure of the global investment grade fixed-rate debt markets. This multi-currency benchmark includes treasury, government-related, corporate and securitized fixed-rate bonds from both developed and emerging markets issuers. There are four regional aggregate benchmarks that largely comprise the Global Aggregate Index: The US Aggregate, the Pan-European Aggregate, the Asian-Pacific Aggregate and the Canadian Aggregate Indices. The Global Aggregate Index also includes Eurodollar, Euro-Yen, and 144A Index-eligible securities, and debt from five local currency markets not tracked by the regional aggregate benchmarks (CLP, MXN, ZAR, ILS and TRY).
BLOOMBERG US AGGREGATE BOND INDEX: The Bloomberg US Aggregate Bond Index is a broad-based flagship benchmark that measures the investment grade, US dollar denominated, fixed-rate taxable bond market. The index includes Treasuries, government-related and corporate securities, fixed rate agency MBS, ABS and CMBS (agency and non-agency).
HFRI MACRO INDEX: The HFRI Macro Index is a sub-index of the HFRI Fund Weighted Composite Index and is composite index of over 900 Investment Managers which trade a broad range of strategies in which the investment process is predicated on movements in underlying economic variables and the impact these have on equity, fixed income, hard currency and commodity markets.
MSCI WORLD INDEX: A market cap weighted stock market index of 1,652 global stocks and is used as a common benchmark for ‘world’ or ‘global’ stock funds. The index includes a collection of stocks of all the developed markets in the world, as defined by MSCI. The index includes securities from 23 countries but excludes stocks from emerging and frontier economies.
S&P 500 TOTAL RETURN INDEX: An unmanaged, market value-weighted index measuring the performance of 500 U.S. stocks chosen for market size, liquidity, and industry group representation. Includes the reinvestment of dividends. The S&P 500 index components and their weightings are determined by S&P Dow Jones Indices.
60/40 PORTFOLIO or GLOBAL 60/40 PORTFOLIO: Reflects a hypothetical portfolio with a 60% allocation to equities and a 40% allocation to bonds as represented by the MSCI World Index and the Bloomberg Global Aggregate Index, rebalanced monthly. Performance of the underlying stock and bond indices is calculated on a gross basis. This is a hypothetical composite portfolio that is not investable. Please refer to important disclosures at the end of this document regarding hypothetical performance.
HYPOTHETICAL PERFORMANCE RESULTS HAVE MANY INHERENT LIMITATIONS. NO REPRESENTATION IS BEING MADE THAT ANY ACCOUNT WILL OR IS LIKELY TO ACHIEVE PROFITS OR LOSSES SIMILAR TO THOSE SHOWN. IN FACT, THERE ARE FREQUENTLY SHARP DIFFERENCES BETWEEN HYPOTHETICAL PERFORMANCE RESULTS AND THE ACTUAL RESULTS SUBSEQUENTLY ACHIEVED BY ANY PARTICULAR TRADING PROGRAM. ONE OF THE LIMITATIONS OF HYPOTHETICAL PERFORMANCE RESULTS IS THAT THEY ARE GENERALLY PREPARED WITH THE BENEFIT OF HINDSIGHT. IN ADDITION, HYPOTHETICAL TRADING DOES NOT INVOLVE FINANCIAL RISK, AND NO HYPOTHETICAL TRADING RECORD CAN COMPLETELY ACCOUNT FOR THE IMPACT OF FINANCIAL RISK IN ACTUAL TRADING. FOR EXAMPLE, THE ABILITY TO WITHSTAND LOSSES OR TO ADHERE TO A PARTICULAR TRADING PROGRAM IN SPITE OF TRADING LOSSES ARE MATERIAL POINTS WHICH CAN ALSO ADVERSELY AFFECT TRADING RESULTS. THERE ARE NUMEROUS OTHER FACTORS RELATED TO THE MARKETS IN GENERAL OR TO THE IMPLEMENTATION OF ANY SPECIFIC TRADING PROGRAM WHICH CANNOT BE FULLY ACCOUNTED FOR IN THE PREPARATION OF HYPOTHETICAL PERFORMANCE RESULTS AND ALL OF WHICH CAN ADVERSELY AFFECT ACTUAL TRADING RESULTS.
Stocks and bonds are represented by the MSCI World Index and the Bloomberg Global Aggregate Index, respectively, unless otherwise noted.
