Correlation is one of the most widely used measures of diversification and can be a helpful statistical indicator for investors looking to construct a diversified portfolio. However, there are complexities in analyzing correlation and investors should use caution in interpreting it. Here, we highlight a few of these complexities. Ultimately, rather than passively combining assets with low correlation to achieve diversification, investors should use a range of measures to actively analyze diversification. Investors can seek strategies that demonstrate dynamic diversification and are structurally designed to perform differently in different market conditions.
NON-CORRELATION DOES NOT IMPLY INDEPENDENCE
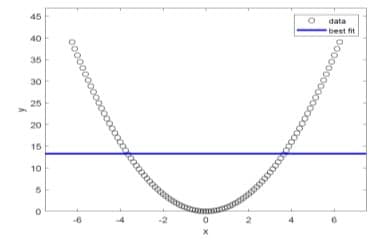
If two variables are independent, then their correlation will be 0. However, it doesn’t go the other way. A correlation of 0 does not imply independence. In the example (right), while y is fully determined by x, the linear correlation between the two, measured by the slope of the best fit, is zero. As shown below, there are many paths that can lead to a given correlation, and even assets with zero correlation can have a clear relationship.
Correlation is (usually) linear1
Examples of non-correlated series
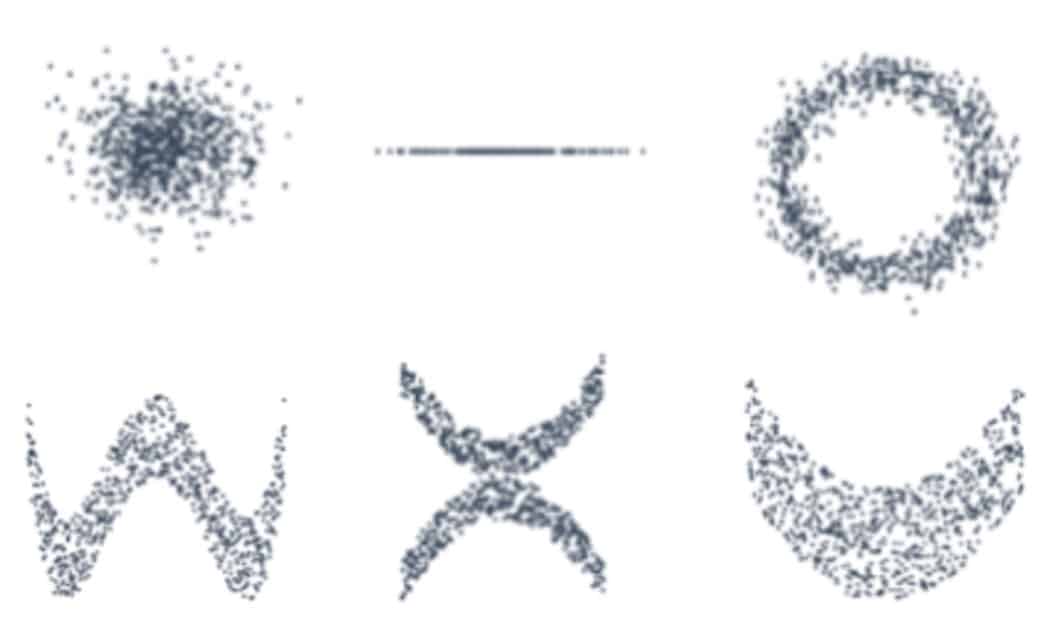
Correlation = 0 for each of the above examples2
CORRELATION IGNORES THE MEAN
Two price series that are highly correlated may move in different directions due to different average returns and vice versa. This means that while the relative movements of the prices might be similar, their absolute levels can diverge significantly over time. For instance, if one asset consistently grows at a faster rate than the other, their price paths can separate despite a high correlation. This divergence underscores the importance of considering both correlation and average returns when analyzing and forecasting price movements. Therefore, solely relying on correlation without accounting for the mean can lead to misleading conclusions about the relationship between two price series.
Two highly correlated assets moving in different directions…1
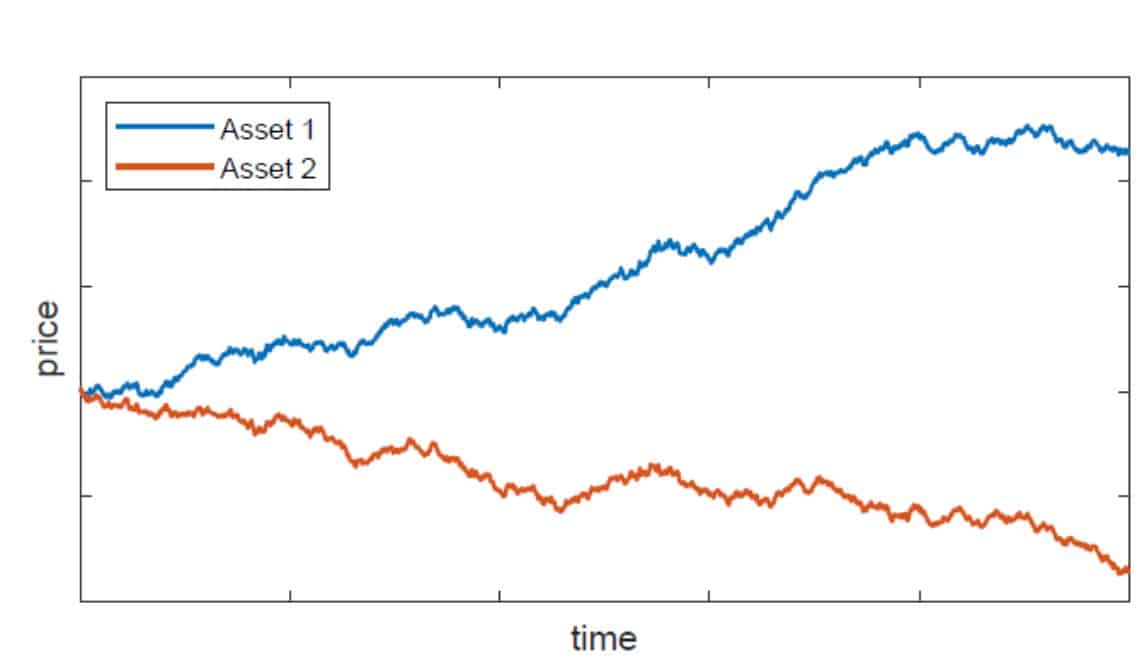
Correlation = 0.8
Two uncorrelated assets moving in the same direction…1
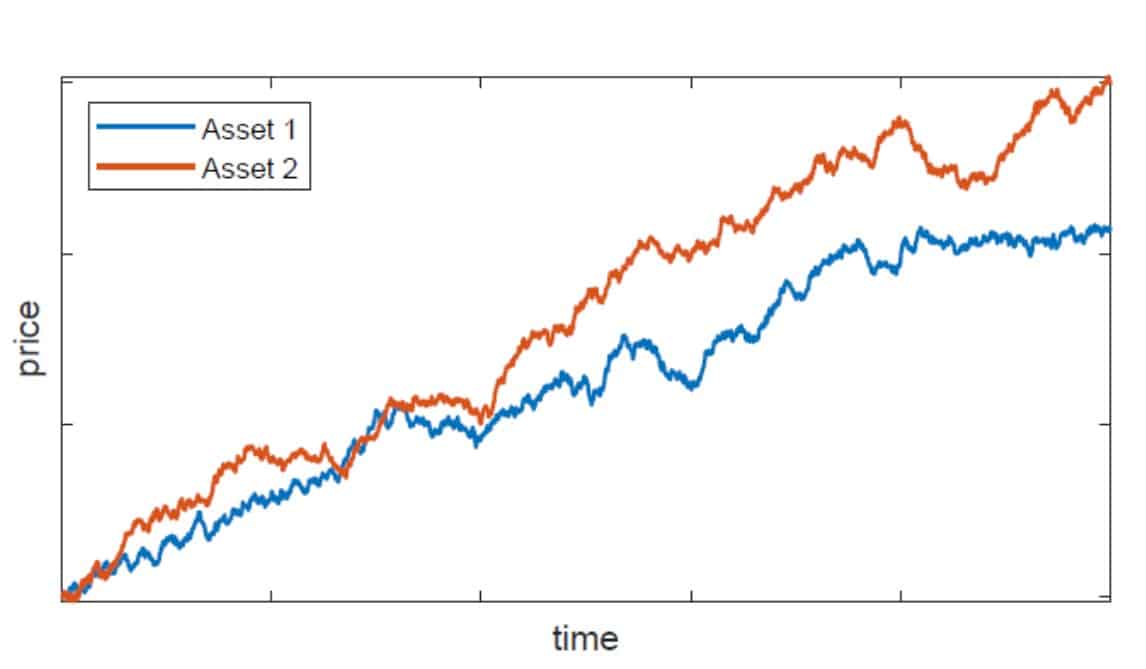
Correlation = 0
CORRELATION ≠ CAUSATION
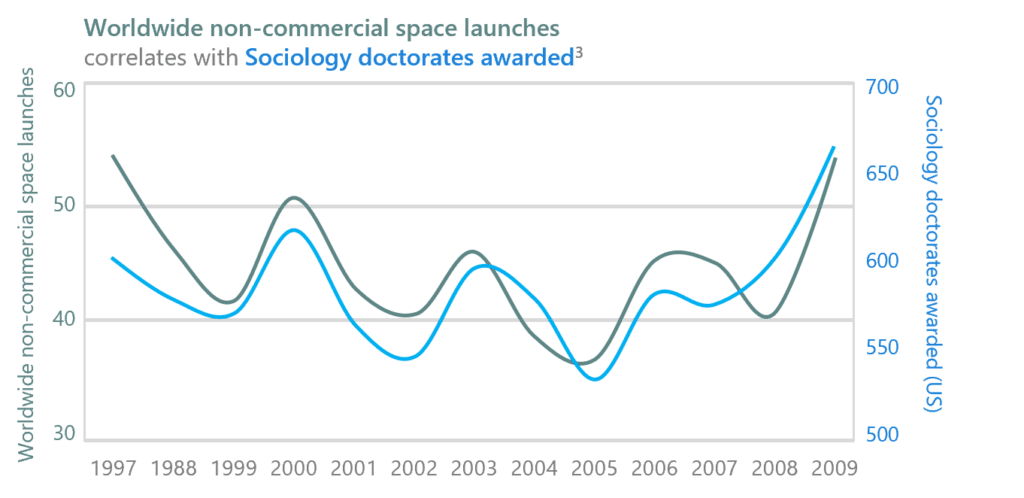
Causation means that one event causes another event to occur. Correlation means there is a relationship or pattern between the values of two variables. However, even if the historical correlation is +1, this does not mean that the asset prices will move the same way in the future. It only means that they have done so in the past.
CORRELATIONS CHANGE OVER TIME
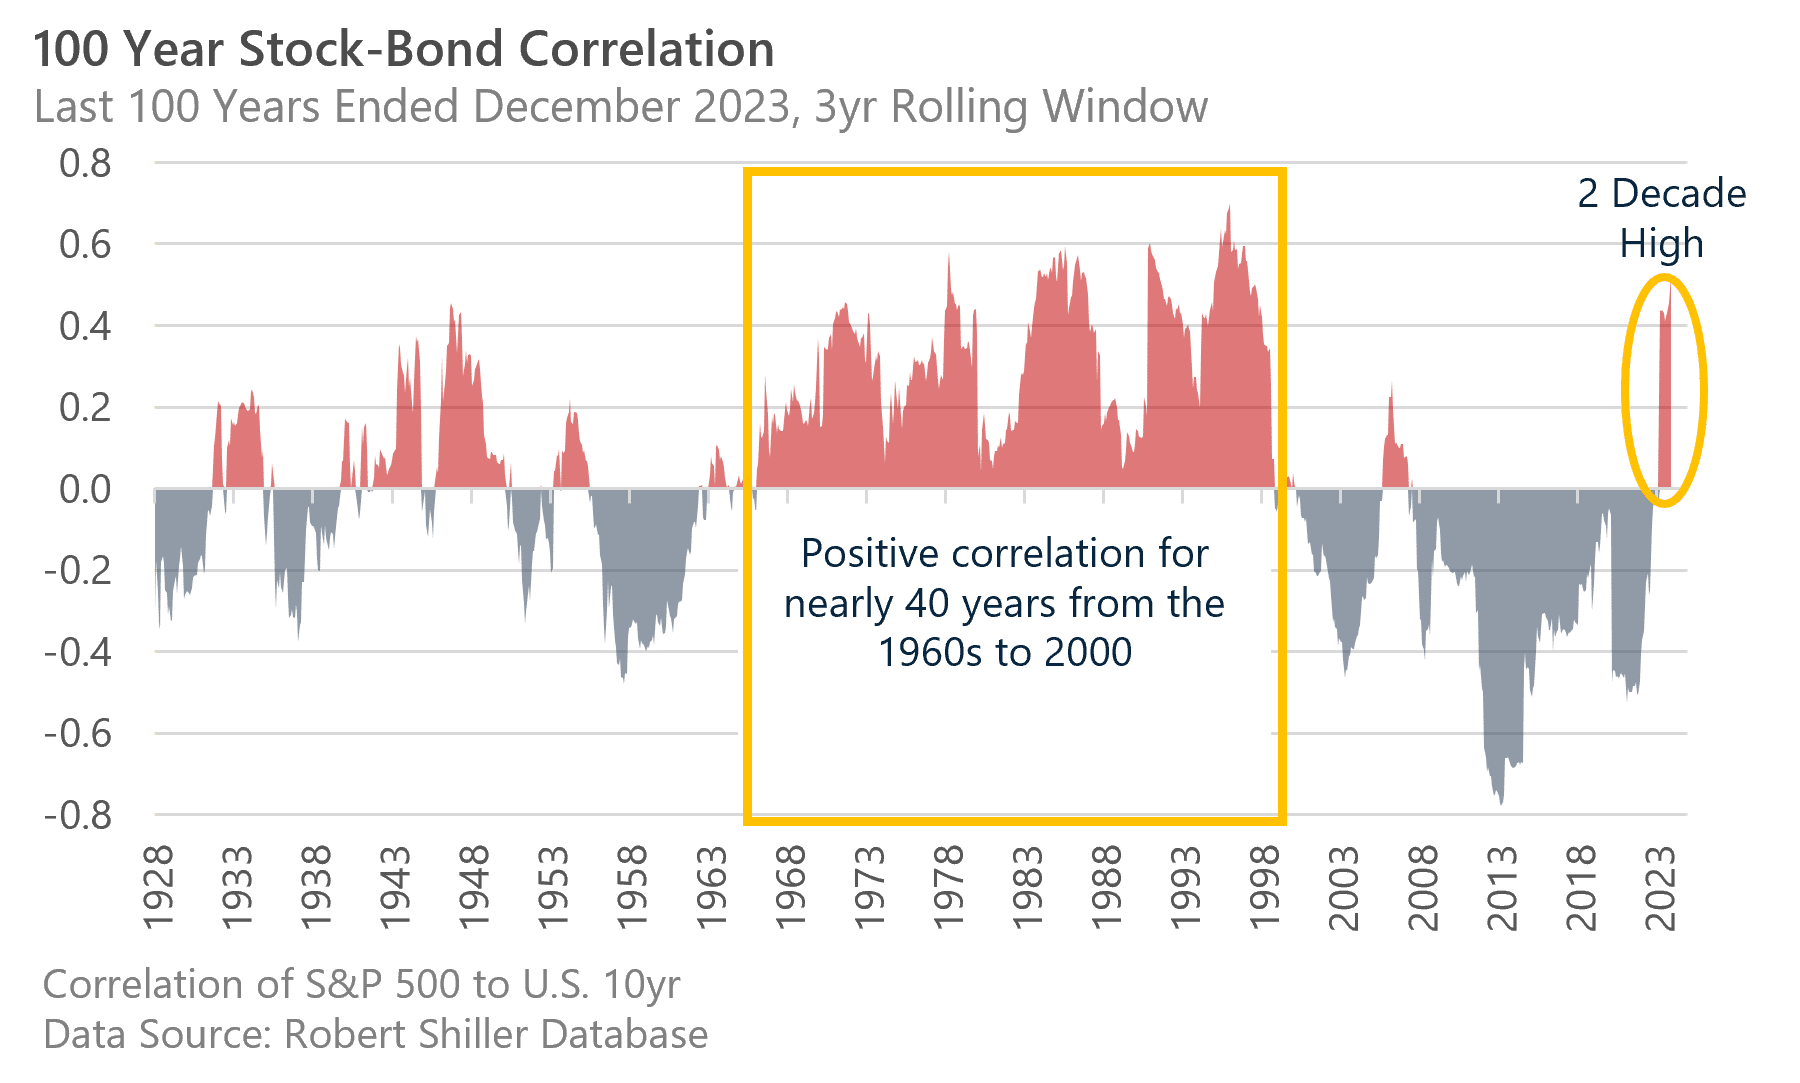
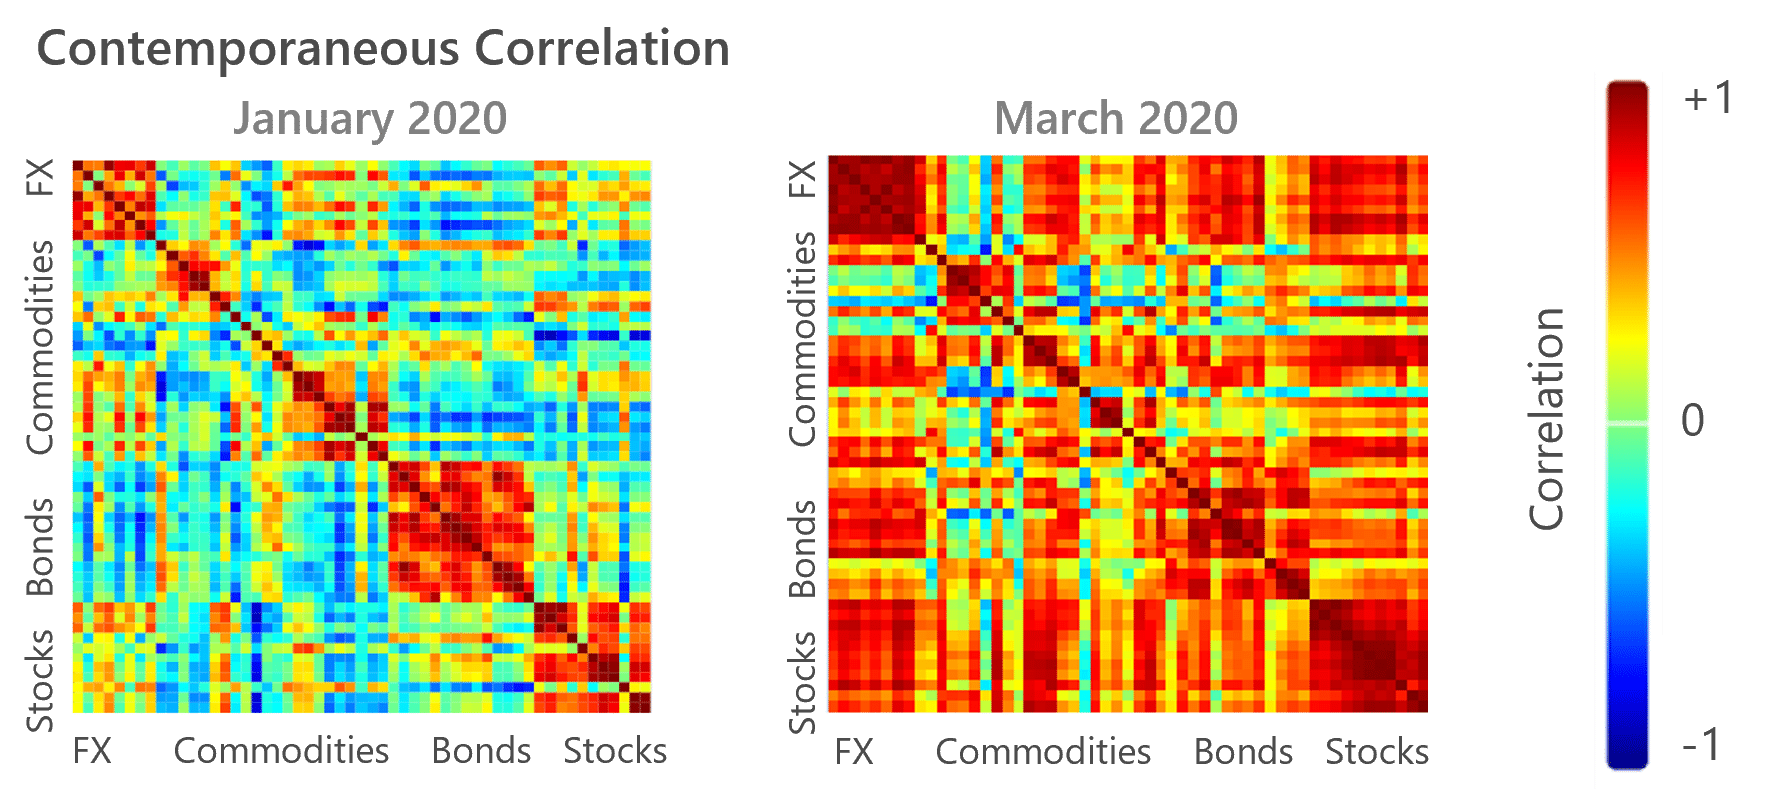
Correlations can change dynamically over time and fluctuate during short- or long-term periods. For example, while negative stock/bond correlation has been the bedrock of many asset allocation strategies since 2000, over a longer time frame there have been prolonged periods where stock/bond correlation was positive. In addition, in periods of high market volatility, shorter-term market correlations tend to move toward a positive coefficient.
Correlations Change: Sometimes slowly…
Sometimes abruptly…
CORRELATIONS MAY BE CONDITIONAL ON THE MARKET ENVIRONMENT
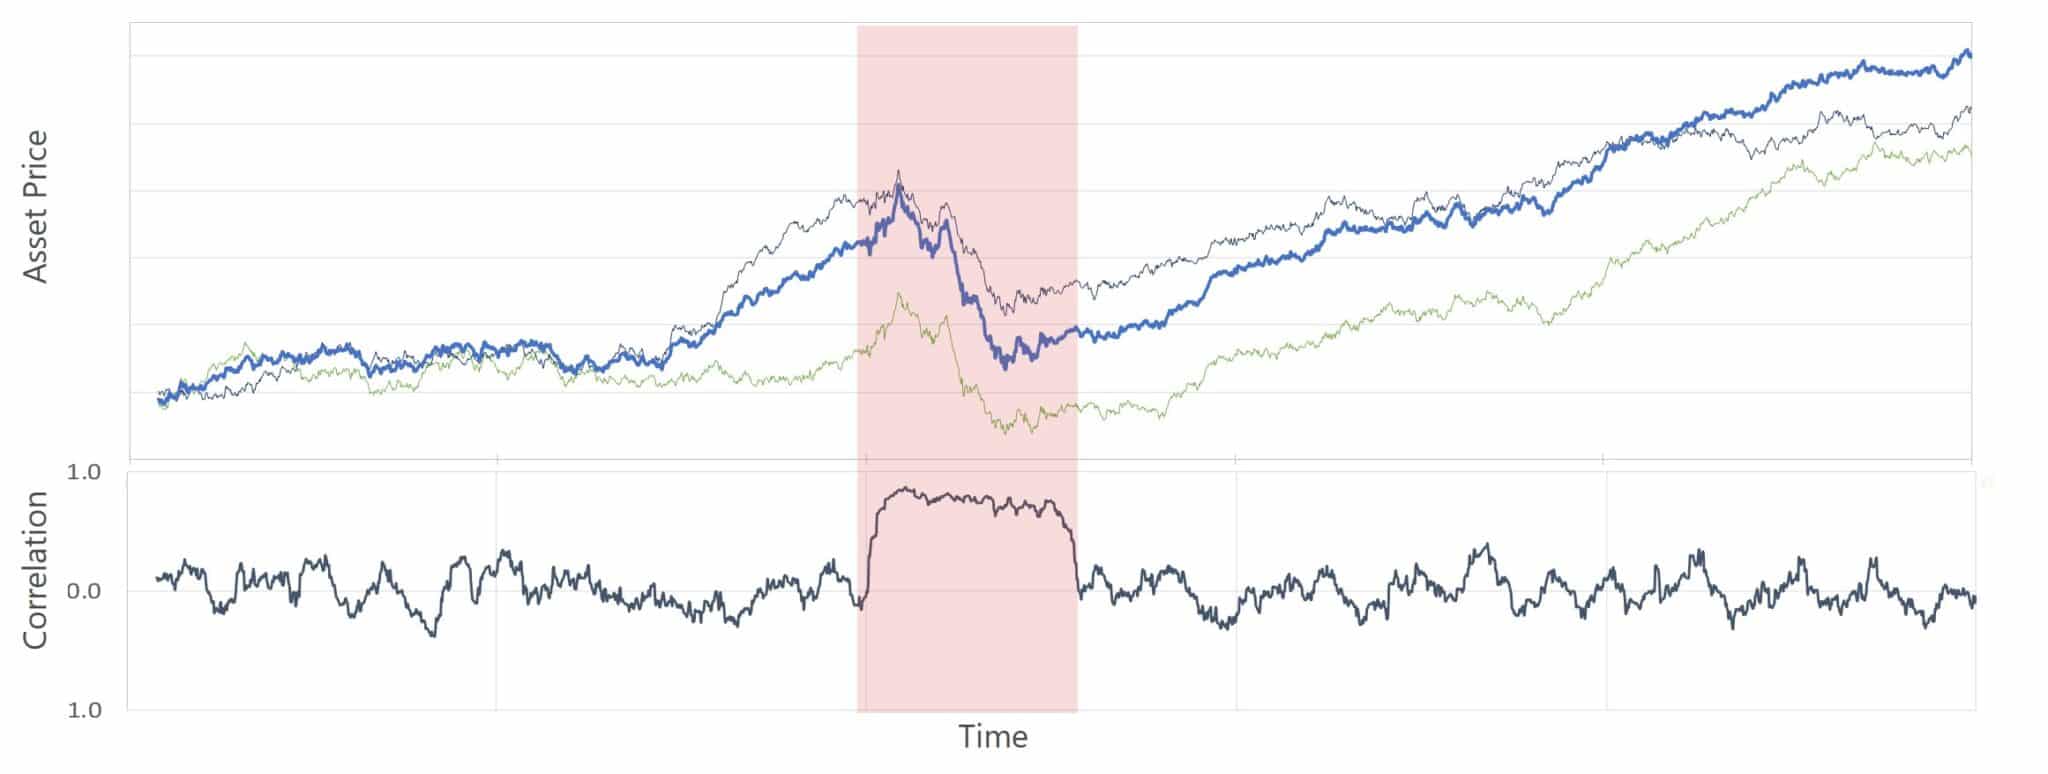
Sometimes asset owners face the worst of all worlds – portfolio diversifiers that are only uncorrelated with their core portfolio in normal market conditions, but become correlated when most needed, when the core is under stress. Conditional correlation may reveal that strategies with high or low overall correlation may behave very differently in down markets (when diversification is needed most):
An example of conditional correlation1
THE IMPORTANCE OF DYNAMIC DIVERSIFICATION
Rather than relying solely on historical correlations, investors should use a variety of metrics to analyze portfolio diversification. As market dynamics continually change, strategies that can dynamically manage portfolio diversification and risk when market correlations increase will continue to be important when constructing a portfolio resilient to changing market conditions. By adopting strategies that offer structural diversification to markets and can adapt to changing market conditions, investors can better navigate uncertain environments and achieve more stable long-term returns.
REFERENCES
1 C. Jones, N. Bethke, and E. Tricker. Contemplating Correlation Research Note, Graham Capital Management, May 2021.
2 https://www.analyticsvidhya.com/
3 https://www.tylervigen.com/spurious-correlations
IMPORTANT DISCLOSURE
Source of data: Graham Capital Management (“Graham”), unless otherwise stated
This document is neither an offer to sell nor a solicitation of any offer to buy shares in any fund managed by Graham and should not be relied on in making any investment decision. Any offering is made only pursuant to the relevant prospectus, together with the current financial statements of the relevant fund and the relevant subscription documents all of which must be read in their entirety. No offer to purchase shares will be made or accepted prior to receipt by the offeree of these documents and the completion of all appropriate documentation. The shares have not and will not be registered for sale, and there will be no public offering of the shares. No offer to sell (or solicitation of an offer to buy) will be made in any jurisdiction in which such offer or solicitation would be unlawful. No representation is given that any statements made in this document are correct or that objectives will be achieved. This document may contain opinions of Graham and such opinions are subject to change without notice. Information provided about positions, if any, and attributable performance is intended to provide a balanced commentary, with examples of both profitable and loss-making positions, however this cannot be guaranteed.
It should not be assumed that investments that are described herein will be profitable. Nothing described herein is intended to imply that an investment in the fund is safe, conservative, risk free or risk averse. An investment in funds managed by Graham entails substantial risks and a prospective investor should carefully consider the summary of risk factors included in the Private Offering Memorandum entitled “Risk Factors” in determining whether an investment in the Fund is suitable. This investment does not consider the specific investment objective, financial situation or particular needs of any investor and an investment in the funds managed by Graham is not suitable for all investors. Prospective investors should not rely upon this document for tax, accounting or legal advice. Prospective investors should consult their own tax, legal accounting or other advisors about the issues discussed herein. Investors are also reminded that past performance should not be seen as an indication of future performance and that they might not get back the amount that they originally invested. The price of shares of the funds managed by Graham can go down as well as up and be affected by changes in rates of exchange. No recommendation is made positive or otherwise regarding individual securities mentioned herein.
This presentation includes statements that may constitute forward-looking statements. These statements may be identified by words such as “expects,” “looks forward to,” “anticipates,” “intends,” “plans,” “believes,” “seeks,” estimates,” “will,” “project” or words of similar meaning. In addition, our representatives may from time to time make oral forward-looking statements. Such statements are based on the current expectations and certain assumptions of GCM’s management, and are, therefore, subject to certain risks and uncertainties. A variety of factors, many of which are beyond GCM’s control, affect the operations, performance, business strategy and results of the accounts that it manages and could cause the actual results, performance or achievements of such accounts to be materially different from any future results, performance or achievements that may be expressed or implied by such forward-looking statements or anticipated on the basis of historical trends.
Tables, charts and commentary contained in this document have been prepared on a best efforts basis by Graham using sources it believes to be reliable although it does not guarantee the accuracy of the information on account of possible errors or omissions in the constituent data or calculations. No part of this document may be divulged to any other person, distributed, resold and/or reproduced without the prior written permission of Graham.

