INTRODUCTION
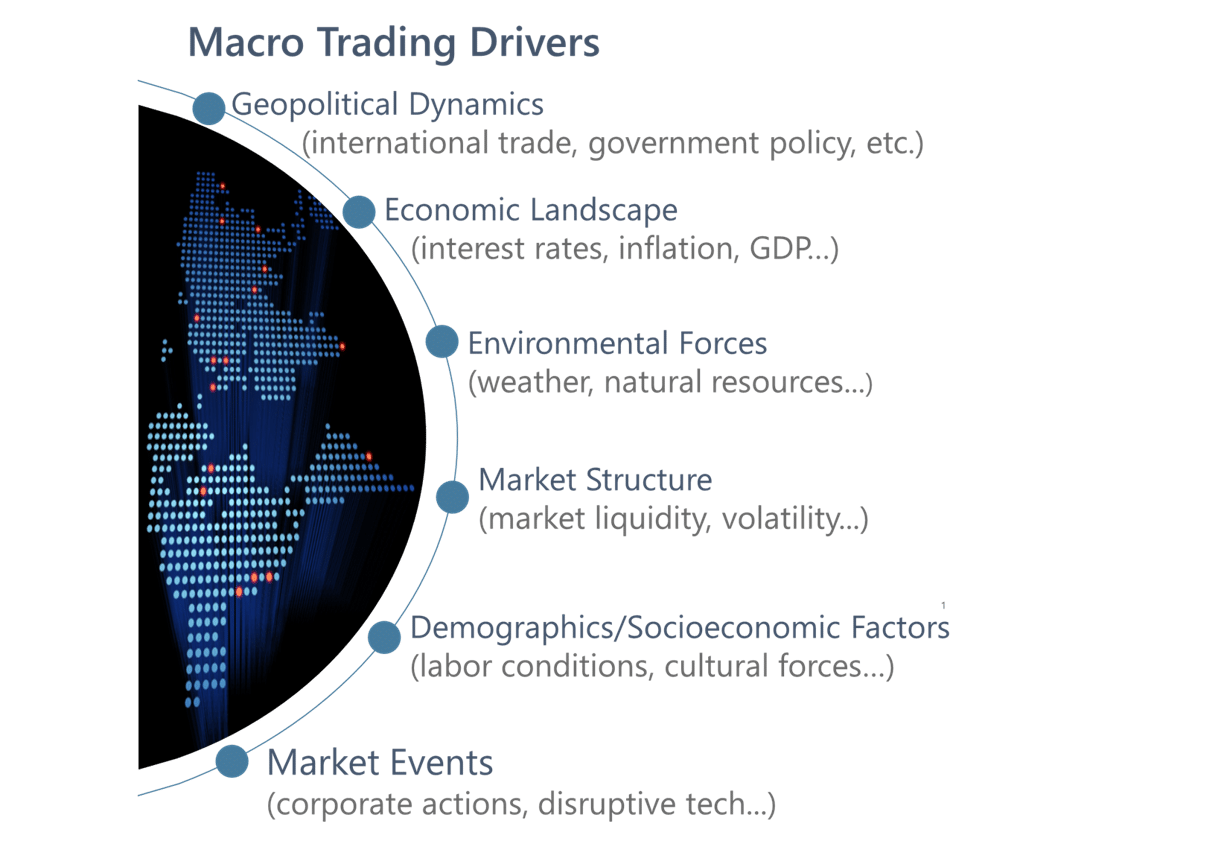
In the alternative investment industry, few strategies capture the breadth and complexity of global markets quite like global macro investing. At its core, global macro is not merely a single investment approach but a comprehensive strategy that seeks to capitalize on broad economic trends and geopolitical developments across the globe. With a focus on understanding and predicting macroeconomic variables such as interest rates, fluctuations in currencies, commodities, credit and equities, along with geopolitical events, global macro managers aim to generate returns by strategically positioning their portfolios to profit from both anticipated and unforeseen shifts in the global landscape. Global macro has demonstrated its ability to perform independently from other asset classes and withstand shifting market dynamics, making it an integral component of a well-diversified portfolio. In this primer, we’ll explore this strategy’s fundamental principles, key performance and investment characteristics, and the role global macro can play in building more resilient investment portfolios.
WHAT IS GLOBAL MACRO?
Global macro is an alternative investment strategy that seeks to profit from fundamental analysis of a range of macroeconomic variables and their potential impact on global markets. Trading is dynamic, with trading themes typically ranging from days to weeks, and positions adjusting as the macro environment changes. Macro offers the potential to provide meaningful diversification and profit opportunities due to its ability to go long or short a diverse market universe and flexibility in trading. The broad spectrum of markets traded have historically resulted in low overall correlation to traditional assets such as stocks and bonds.
Diverse Market Universe
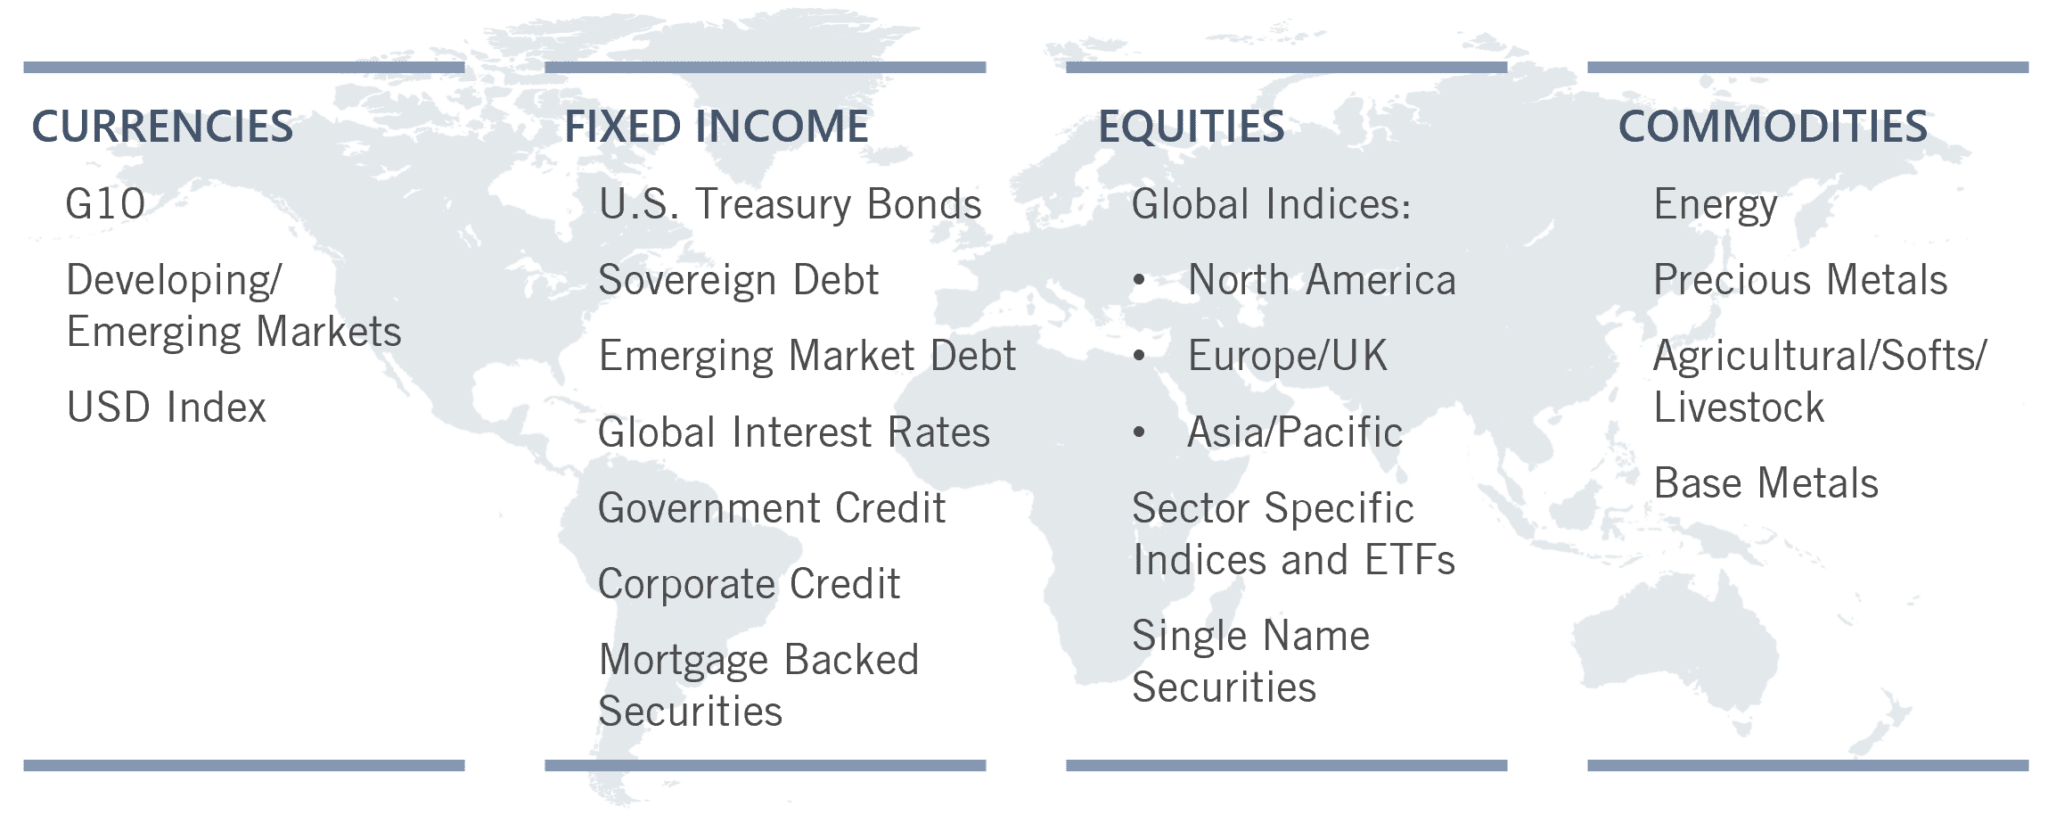
Global macro strategies are broadly diversified by geography and sector. Many macro portfolio managers trade across global currency, fixed income, equity, commodity, and credit markets, with some focused on specific sectors. Common specialties include fixed income relative value, emerging market, or commodity trading. Although macro portfolios tend to trade liquid instruments, they also have the flexibility to trade individual securities and a range of derivatives. This flexibility allows the implementation of more nuanced investment ideas than what may be seen with other strategies.
Markets traded typically include, but are not limited to:
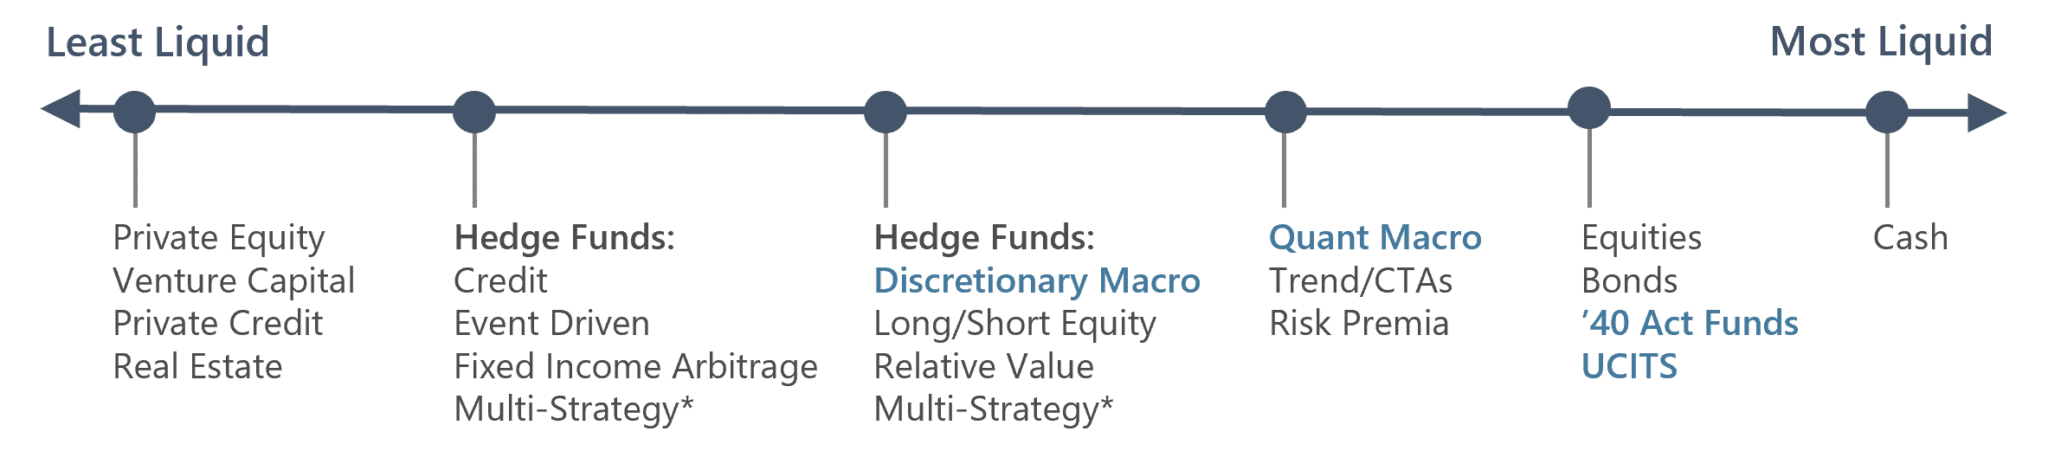
Investor Liquidity
Given the generally liquid nature of the underlying markets and instruments traded, global macro strategies typically do not borrow money or rely on external funding, which is a form of leverage often employed by other hedge fund styles. Leverage for global macro funds tends to be limited to the margin required to trade derivatives. Consequently, global macro funds often have more favorable redemption terms than other alternatives employing less liquid strategies. It’s not uncommon for global macro funds to offer quarterly redemption liquidity or better, with no lock-ups or gates, depending on the specific implementation used (e.g., discretionary versus quantitative or private fund versus ’40 Act or UCITS).
*In recent years, multi-strategy funds have increasingly adopted longer redemption terms, gates, hard/soft lock-up periods, or other mechanisms, which vary significantly among managers and lack standardization, thus falling into the two categories outlined above.
TRADING APPROACHES
Due to their broad investment mandate, the global macro peer group demonstrates significant heterogeneity in both trading approaches and the returns produced by managers.
Single and Multi-Portfolio Manager Funds
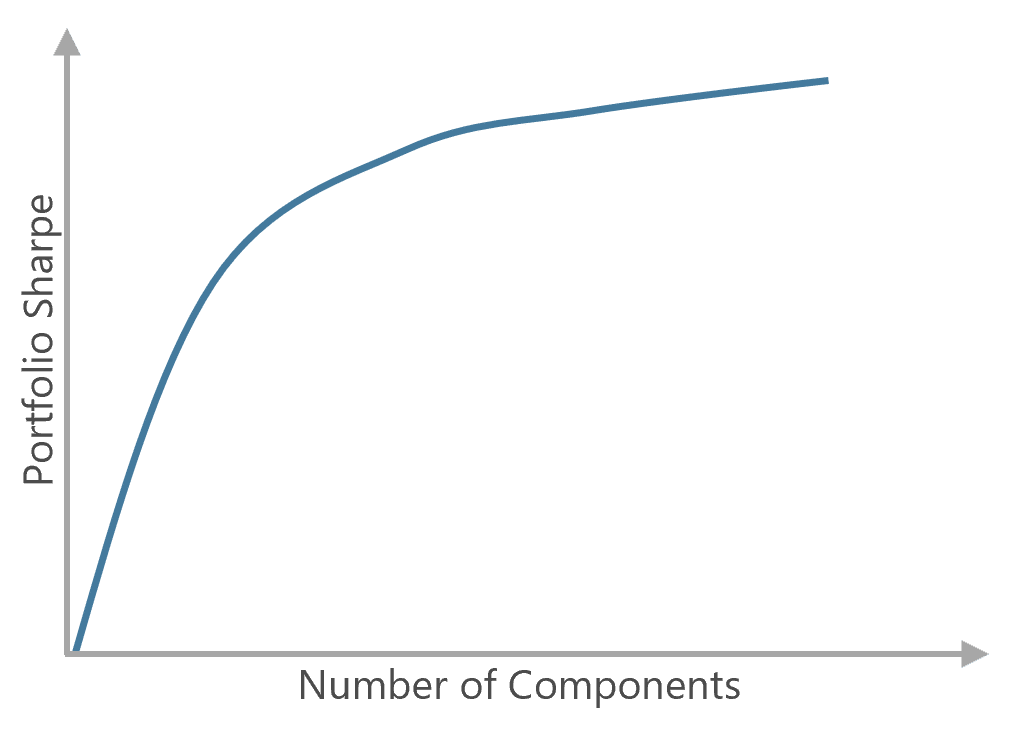
Macro managers may adopt either a single- or multi-portfolio manager (“PM”) macro approach. Single-PM approaches carry concentrated risk and potential for higher returns but increase vulnerability to individual PM views and market disruptions. Multi-PM macro funds diversify risk across multiple strategies, leveraging diverse expertise to reduce downside risk and improve portfolio Sharpe ratio. Success in multi-PM funds often relies on effective portfolio construction techniques, such as position overlap analysis, correlation matrices, and robust risk management rather than outsized returns of individual components. For instance, a hypothetical portfolio of 10 uncorrelated strategies, each with a standalone Sharpe ratio of 0.5, would yield a portfolio-level Sharpe ratio of 1.6, all else being equal (as outlined in Graham’s Insight Series, Diversify and Conquer). Multi-PM macro platforms aim for consistent performance by spreading risk among multiple managers and strategies.
Hypothetical Relationship between Number of Components and Sharpe Ratio
As components are added, the Portfolio Sharpe ratio increases as it can benefit from uncorrelated return sources. However, there is a limit where additional components may not improve performance as correlations increase and the diversification benefit to the portfolio deteriorates.
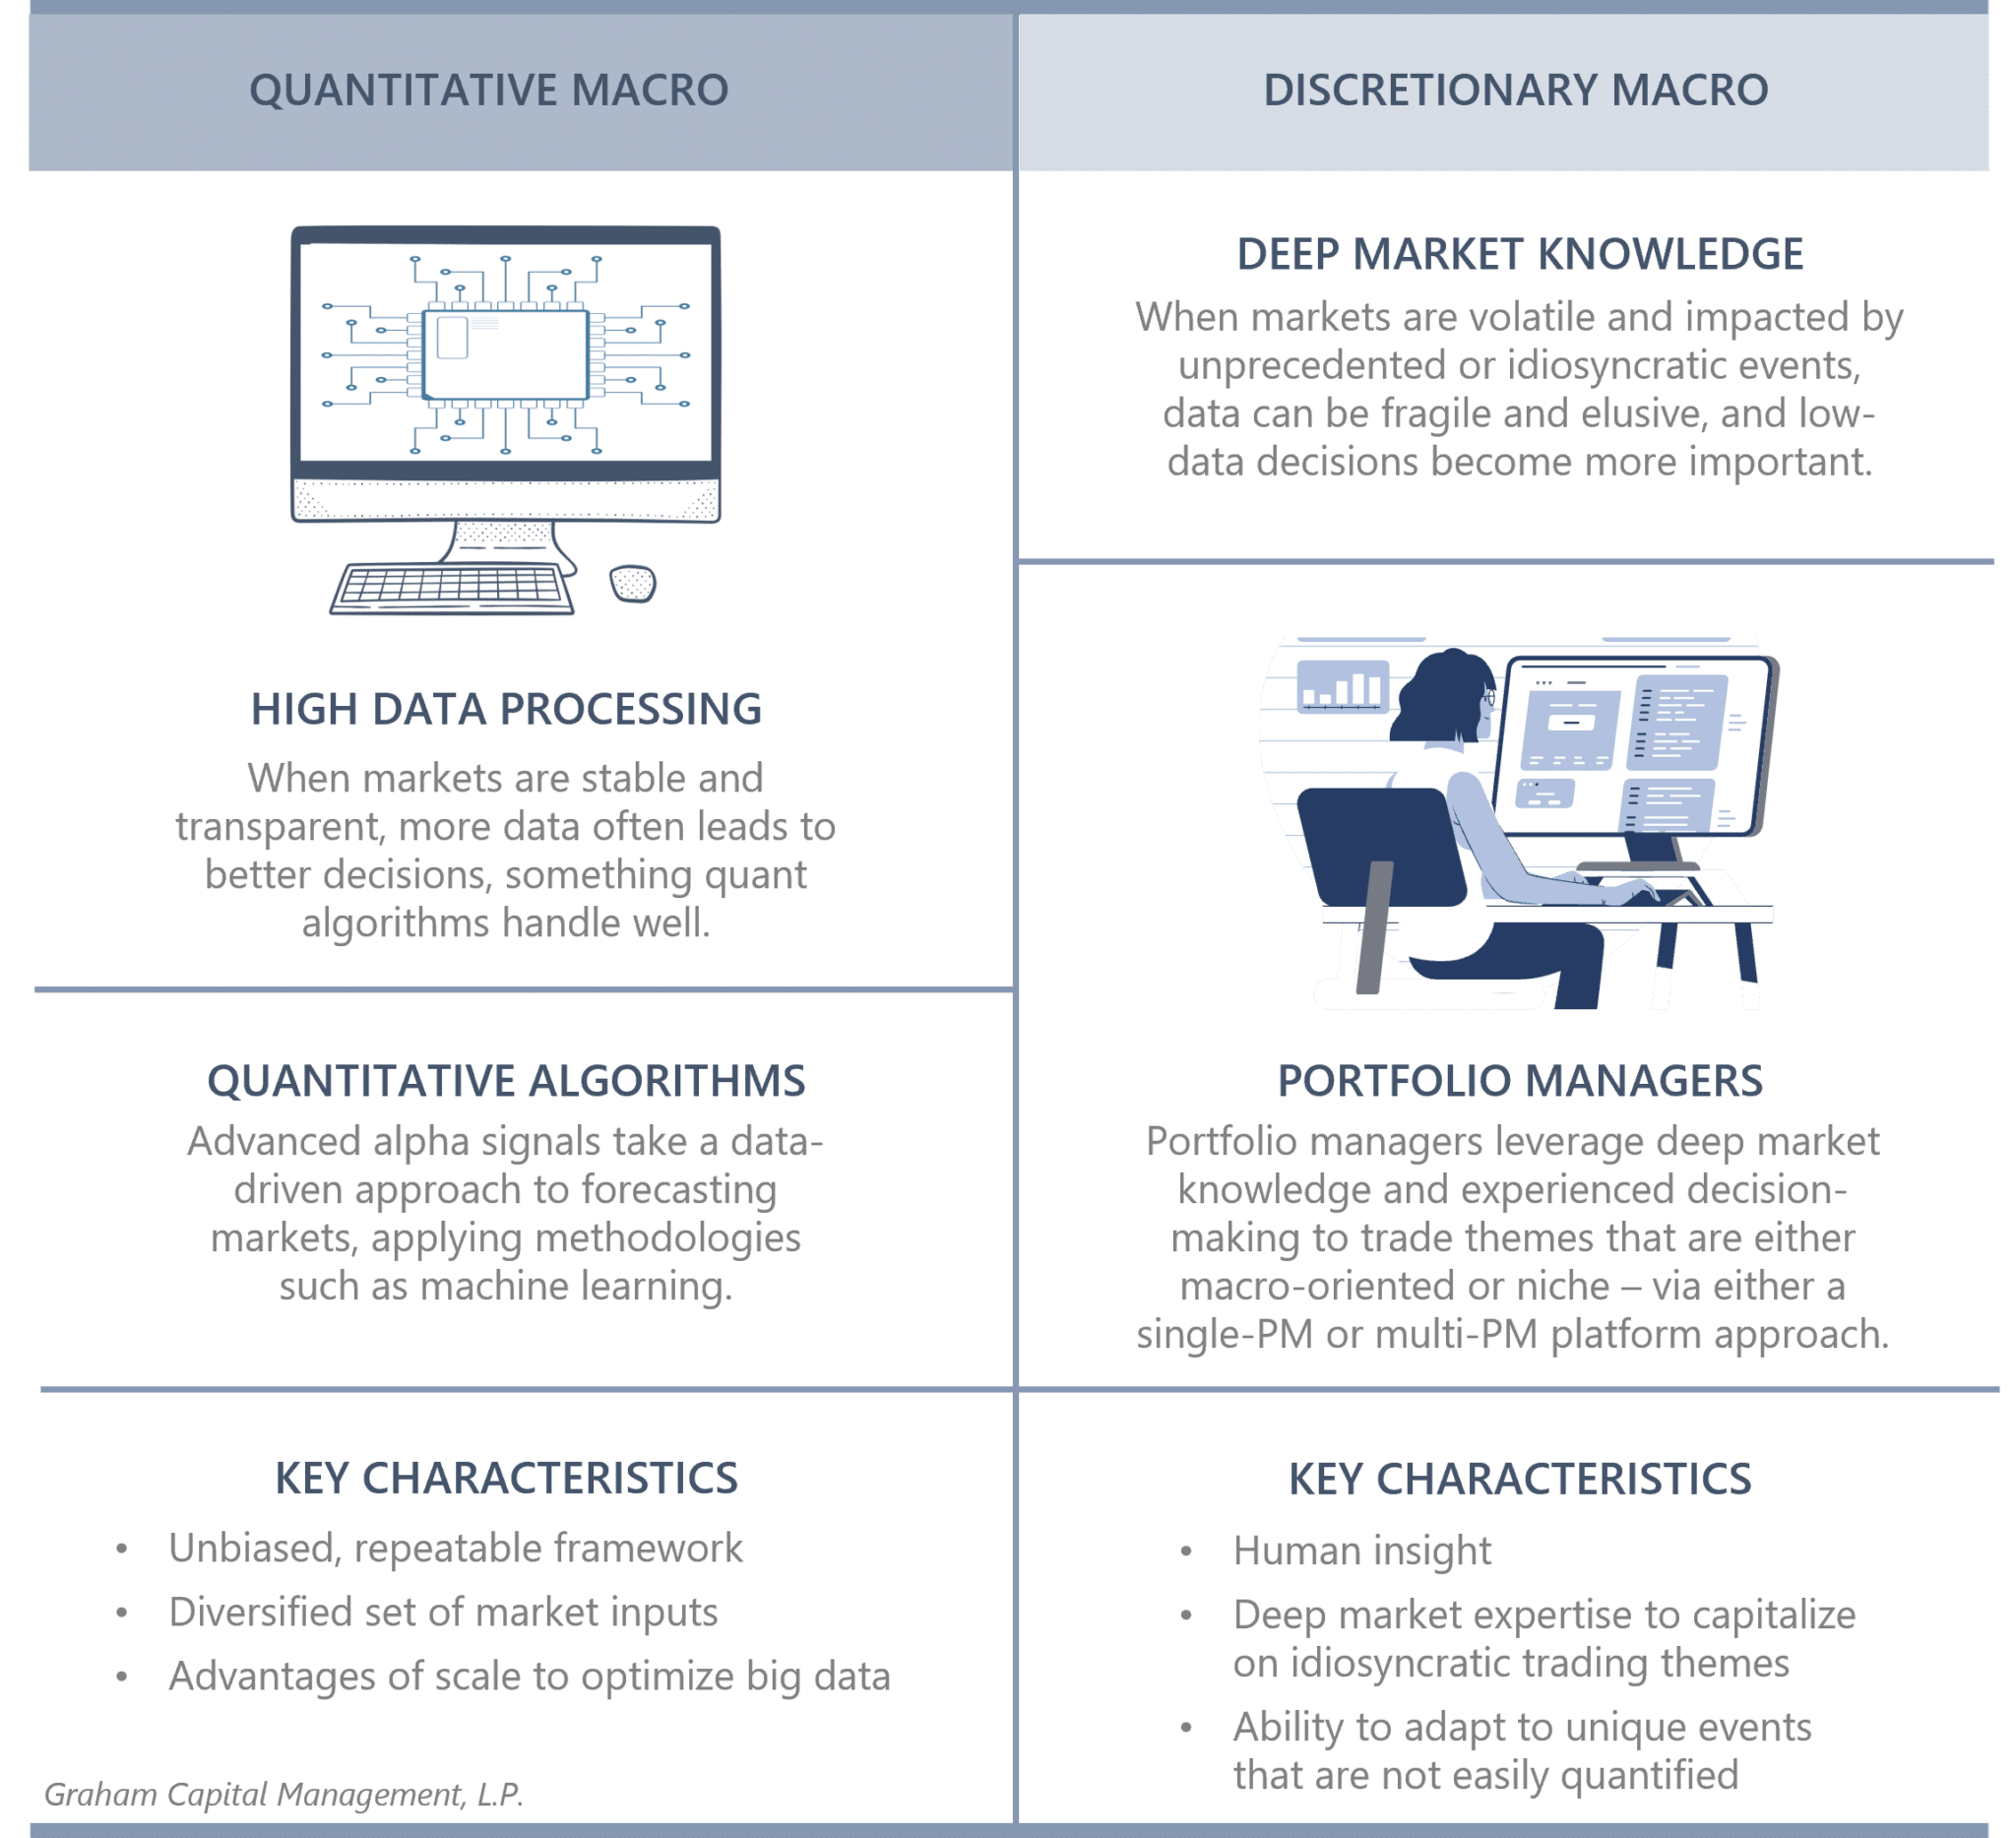
Quantitative and Discretionary Macro
Two prominent global macro trading styles are quantitative (systematic) and discretionary. Both analyze fundamental macroeconomic indicators to forecast shifts in market prices; however, they do so in different ways and each offers its own advantages. Quantitative approaches employ algorithms to analyze data and generate position signals, while discretionary approaches rely on human insight and subjective decision-making. Quantitative macro can excel in handling vast datasets within stable and transparent markets, while discretionary macro can adeptly navigate unprecedented or specialized themes, particularly in scenarios where data is more fragile or elusive. Over time these two styles have had low correlation to each other.
GENERIC TRADE EXAMPLE
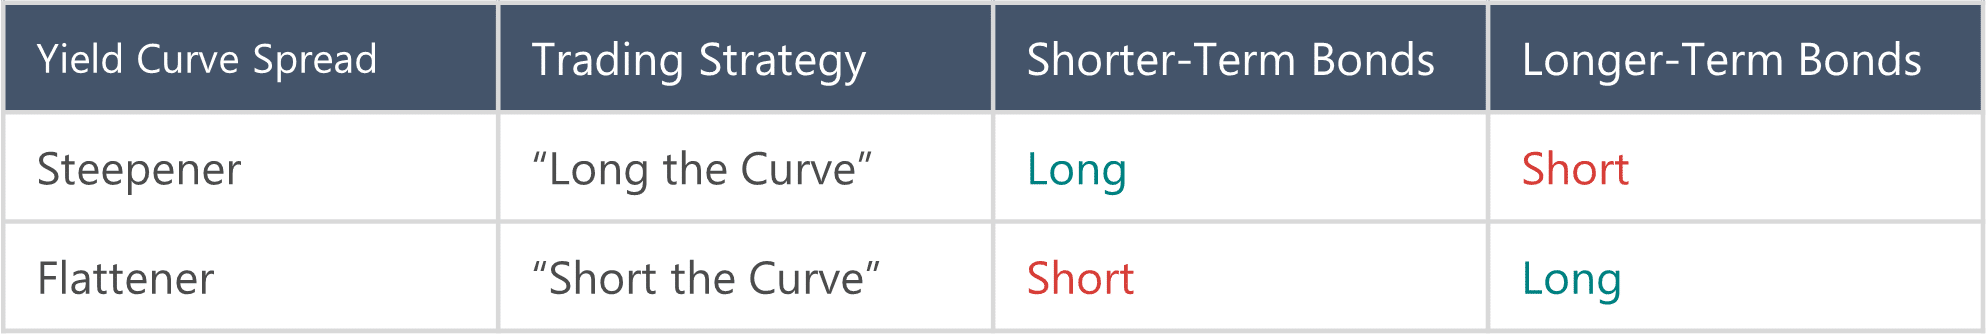
Global macro trading can capitalize on a variety of macroeconomic themes across a broad market universe. A classic example often revolves around yield curve dynamics, where managers may exploit changes in the yield curve’s shape by capitalizing on the spread between short- and long-term rates.
Trading the Yield Curve Spread
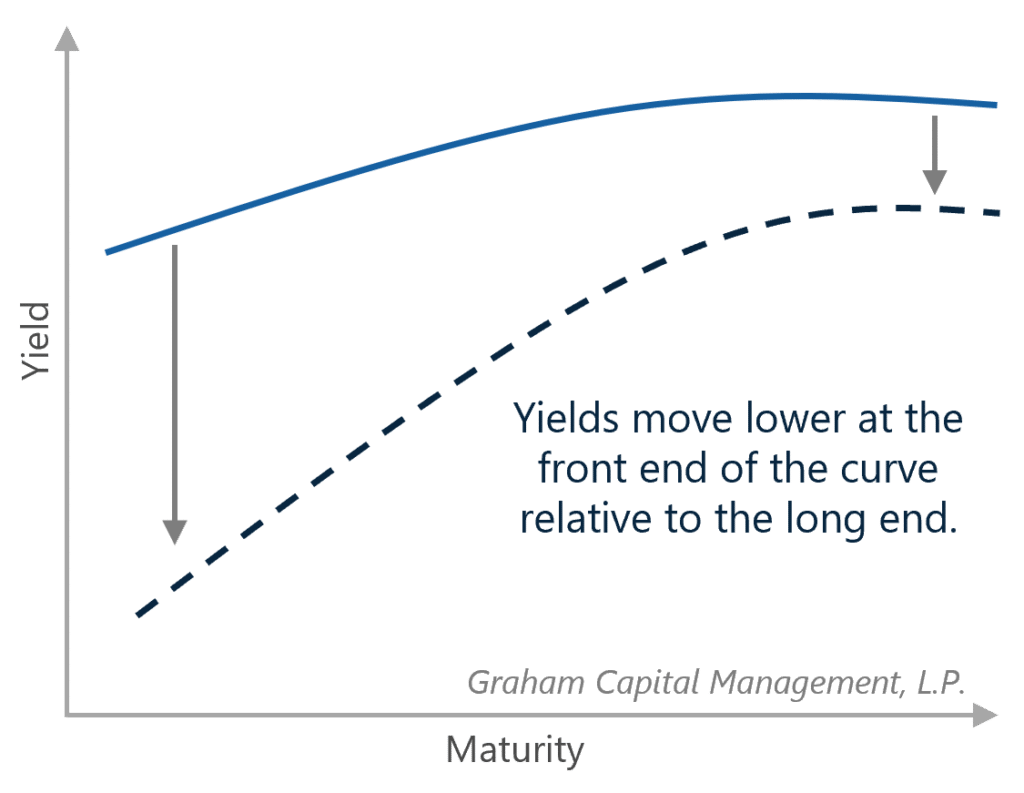
Bull Steepener
→ Common trade during periods of monetary easing
The yield curve steepens either from long-term rates rising faster than short-term rates (bear steepener) or from short-term rates falling faster than long-term rates (bull steepener). When traders expect the yield curve to steepen they will go long short-term bonds and short long-term bonds. As the difference between rates widens, the trader should earn more on the short-term bonds they bought than they lose on the long-term bonds they sold.
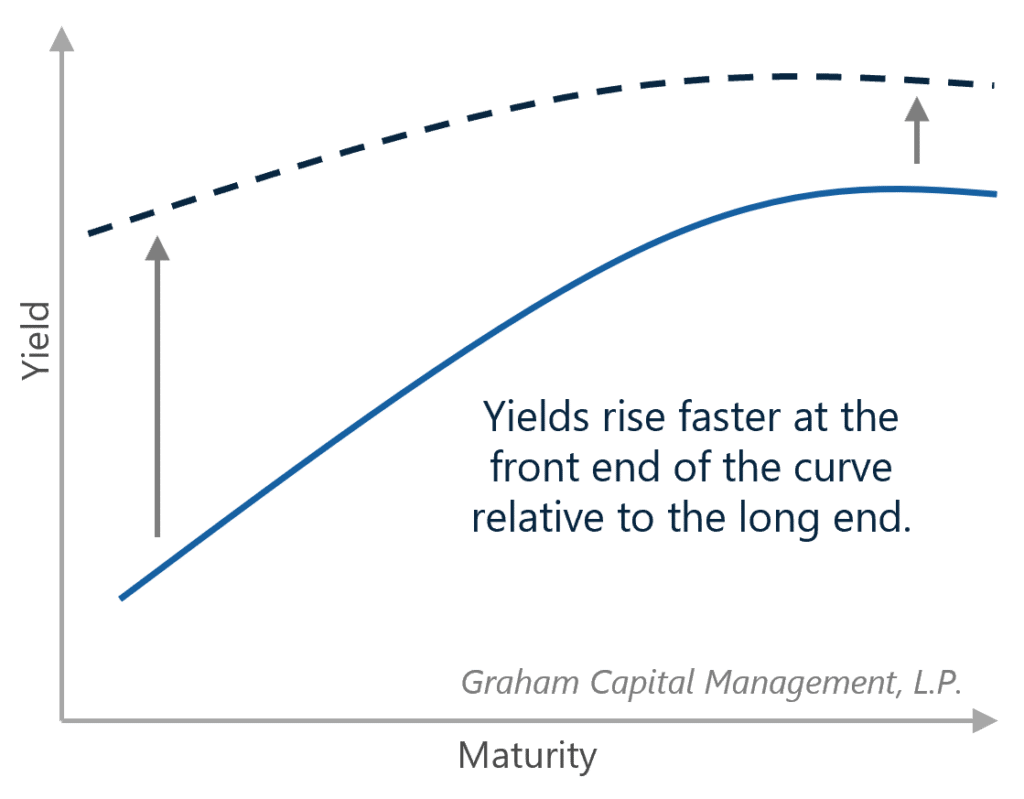
Bear Flattener
→ Common trade during periods of monetary tightening
The yield curve flattens either from long-term rates falling faster than short-term rates (bull flattener) or from short-term rates rising faster than long-term rates (bear flattener). When traders expect a flattener, they will sell short-term bonds and buy long-term bonds. As the difference between rates narrows, the trader should earn more from the short-term bonds they sold short, than they lose on the long-term bonds they bought.
DIVERSIFICATION BENEFITS OF MACRO
The “Go Anywhere” Strategy
At its core, global macro is a dynamic and tactical strategy that can adapt to a variety of market conditions. The strategy is not reliant on any one market regime, but rather may benefit from economic growth or contraction, inflationary or deflationary environments, or bullish or bearish equity. The strategy is expected to continue to add value to a diversified investment portfolio over the long run whether or not any of these scenarios emerge. The strategy’s ability to navigate diverse market conditions underscores its role as a diversifier within an investment portfolio.
Performance in Rising/Falling Equity Markets
Based on monthly performance, Jan-90 to Dec-23
Data Source: eVestment, HFR, Inc; Chart by Graham Capital Management, L.P.
Both Macro and Trend-Following are well-known diversifiers within a portfolio, as demonstrated above, but they achieve this diversification in different ways and have different – albeit complementary – return profiles, as shown within the ensuing “Summary Statistics” table. While these details fall beyond the scope of this paper, please refer to Graham’s Trend Following Primer for additional information.
Nevertheless, certain market contexts have proven to be more favorable for global macro than others. Macro returns strongly correspond to sustained directional moves in markets. Macro performs well during periods of strong market directionality (often when there is a clear catalyst for market shifts). Shorter-term market volatility that often results in choppy, range-bound markets may be more challenging for the strategy.
For example, market events or significant policy changes often provide ample opportunities for global macro funds, as these macroeconomic factors drive market volatility, as seen during events like the burst of the technology bubble in the early 2000s, the Global Financial Crisis of 2008, and the inflation surge in 2022. In periods of stable interest rates and limited macroeconomic volatility, macroeconomic factors may have less impact on market movements, which can reduce trading opportunities and result in more muted returns. Macro strategies are also not immune to unexpected market disruptions, as shown by events like the “Taper Tantrum” of May 2013 and the Silicon Valley Bank collapse in March 2023.
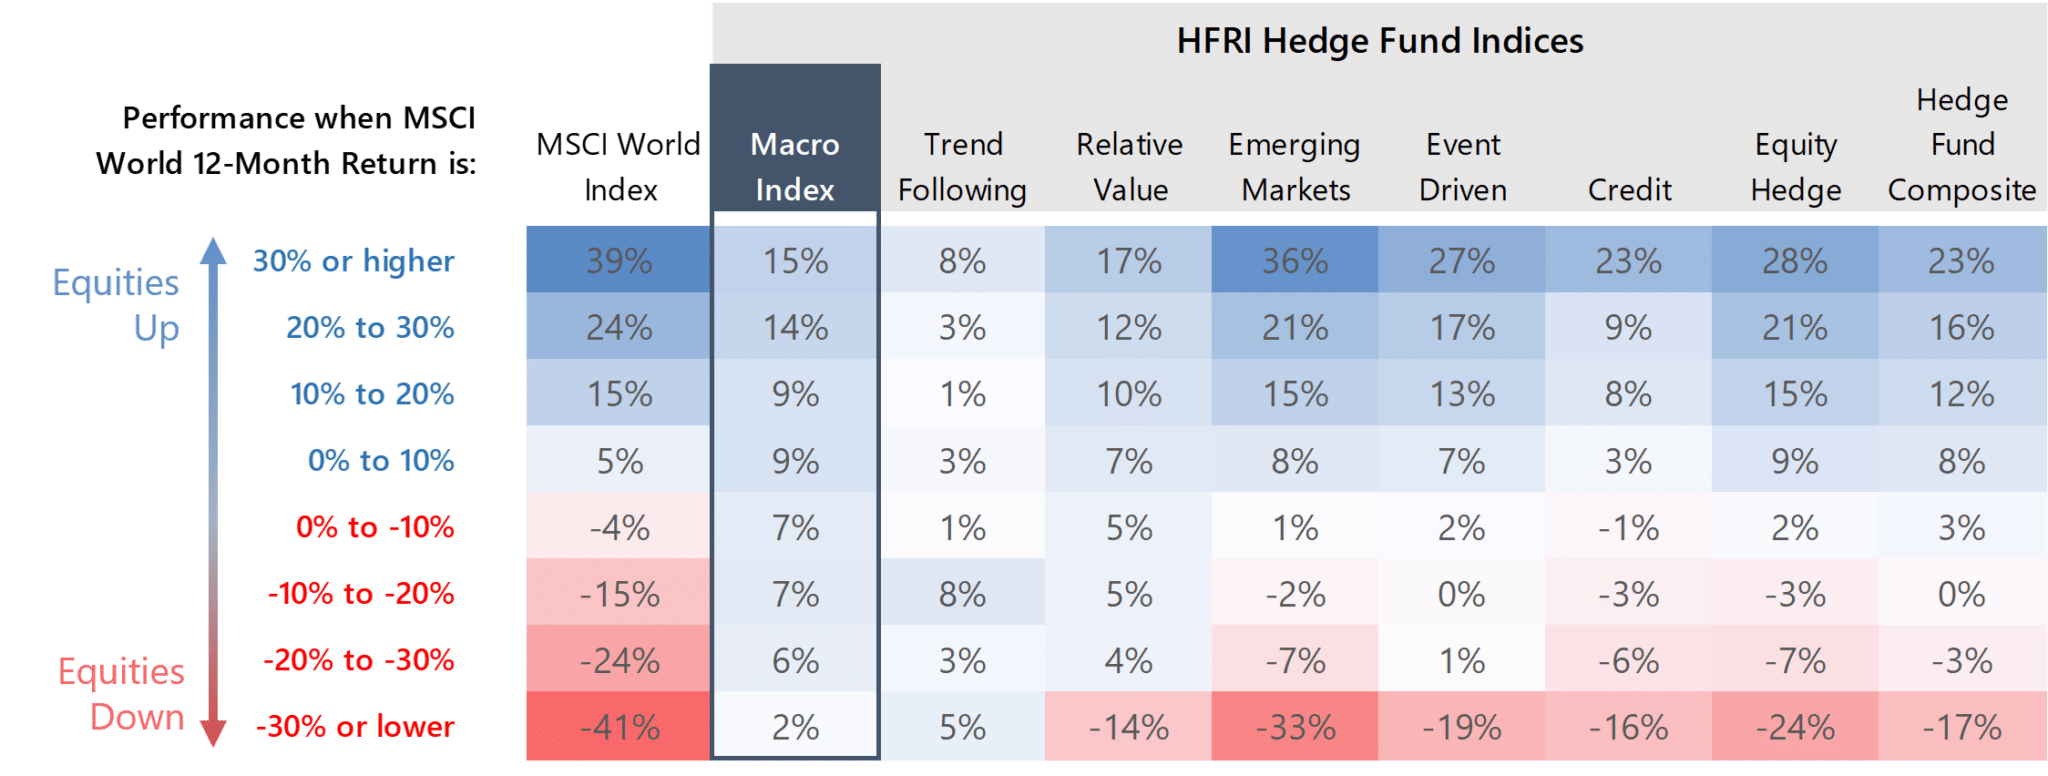
Low Correlation to Stocks and Bonds
Macro is an uncorrelated, diversifying strategy. The strategy has no persistent long or short bias toward any market and low overall correlation to equities and bonds. Macro can exhibit low to negative correlation to equity and bond indices during periods when the index performs poorly, and low to positive correlation during periods when the index performs well. As a result, macro can perform well during both bull and bear markets.
Jan-90 to Dec-23
Data Source: eVestment, HFR, Inc.
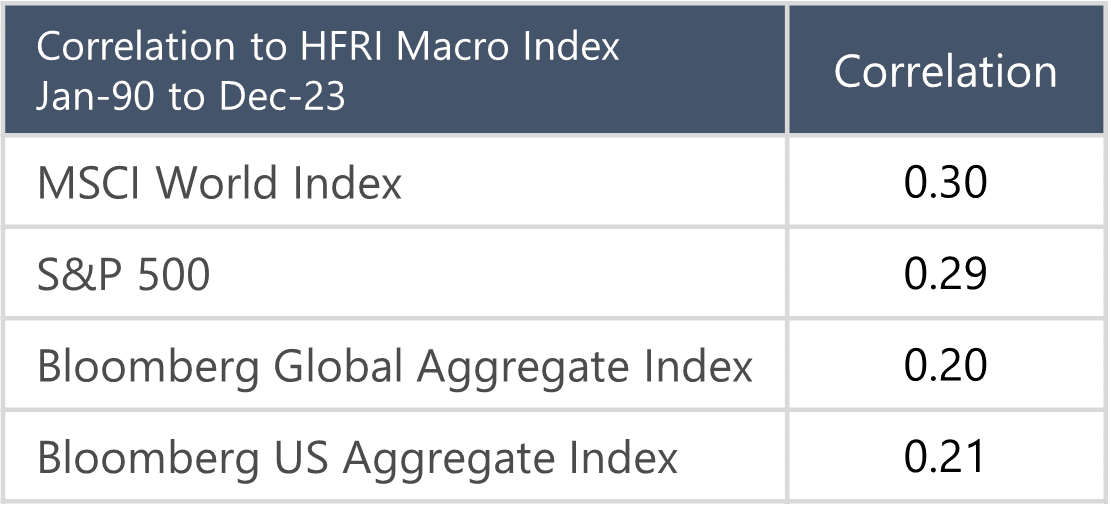
Dynamic Diversification: Conditional Correlation to Equities
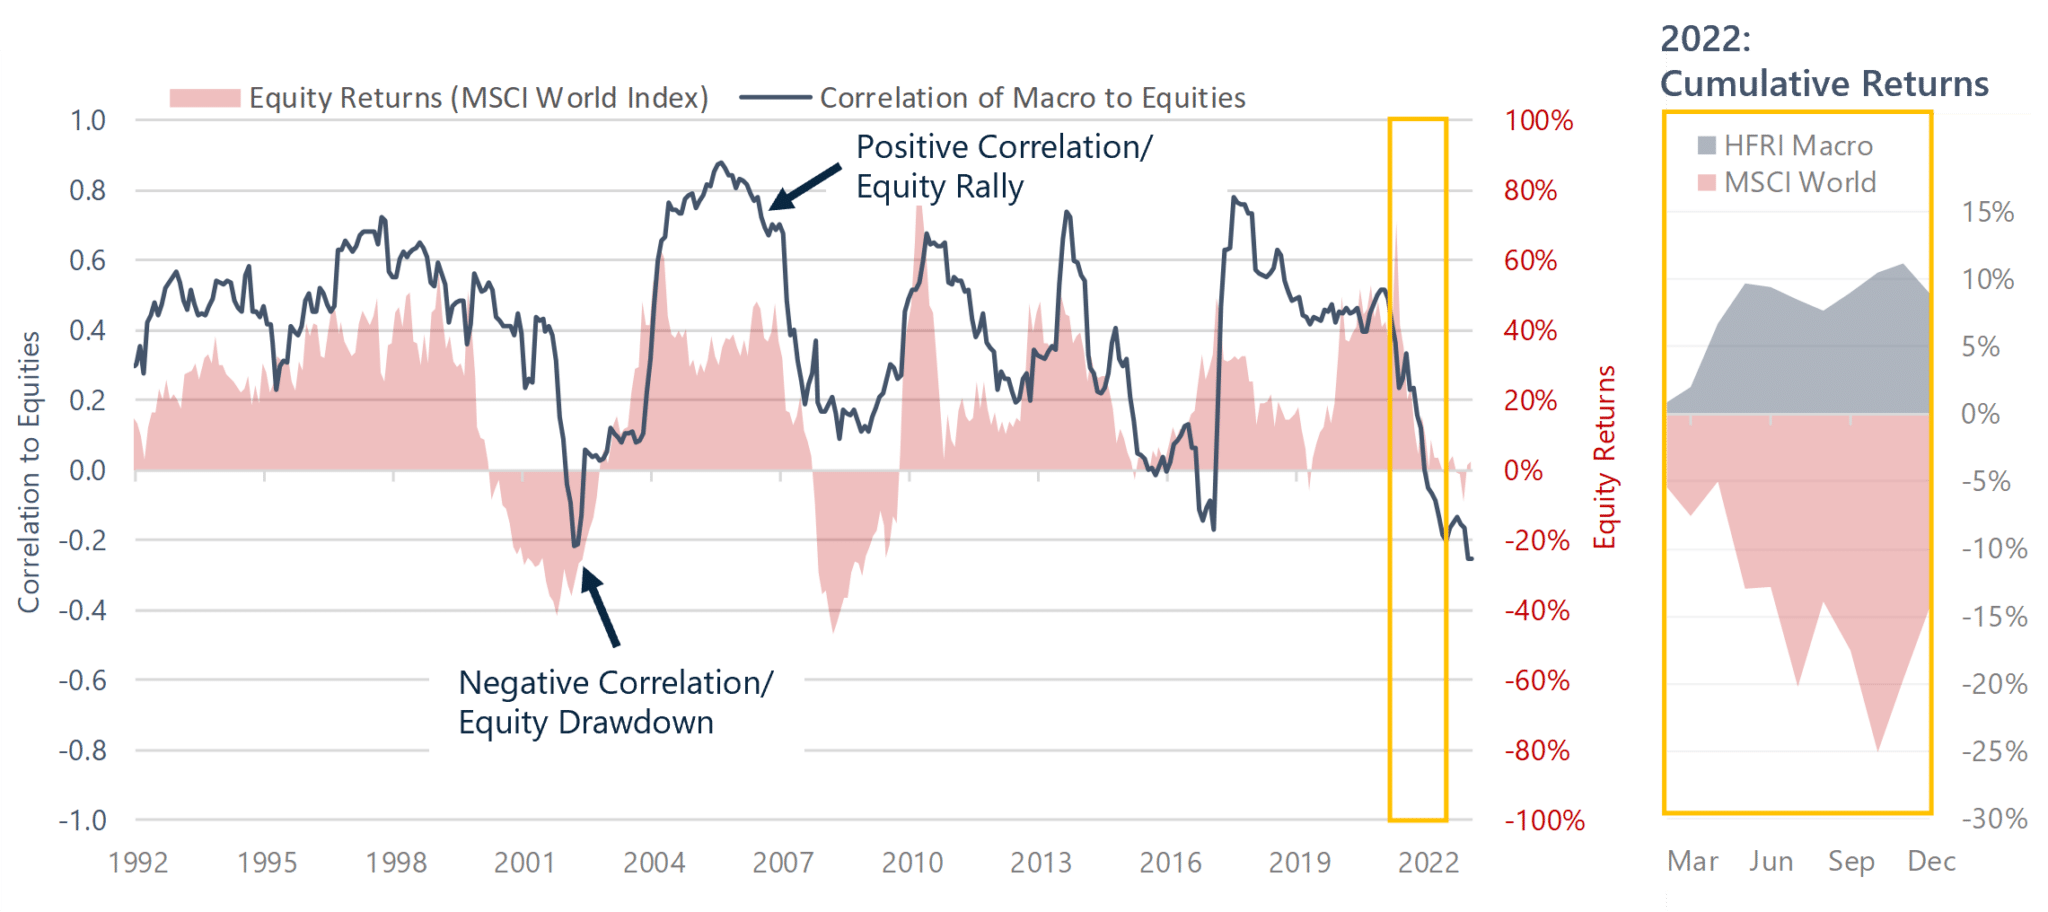
Rolling Correlation of HFRI Macro Index to Equities versus Equity Index Returns
24 month rolling window, Jan-90 to Dec-23
Data Source: eVestment, HFR, Inc. Chart by Graham Capital Management, L.P.
Potential to Mitigate Equity Risk
Global macro has the potential to flourish at times of big dislocations and has historically performed well, on average, during equity sell-offs. For example, as mentioned previously, macro managers were broadly successful during longer-term market declines such as the burst of the technology bubble in the early 2000s, the 2008 Global Financial Crisis, and the 2022 inflationary market environment, as they were able to capitalize on strong market directionality and fundamental catalysts. However, positive performance during equity downturns is not guaranteed and macro should not be thought of exclusively as a portfolio hedge, but rather as a low correlation, diversifying asset over the long-term. For example, sharp reversals and short-term declines can be challenging, as seen in Q1 2020.
Global Macro Performance during Largest 5 Equity Drawdowns (Peak to Trough)
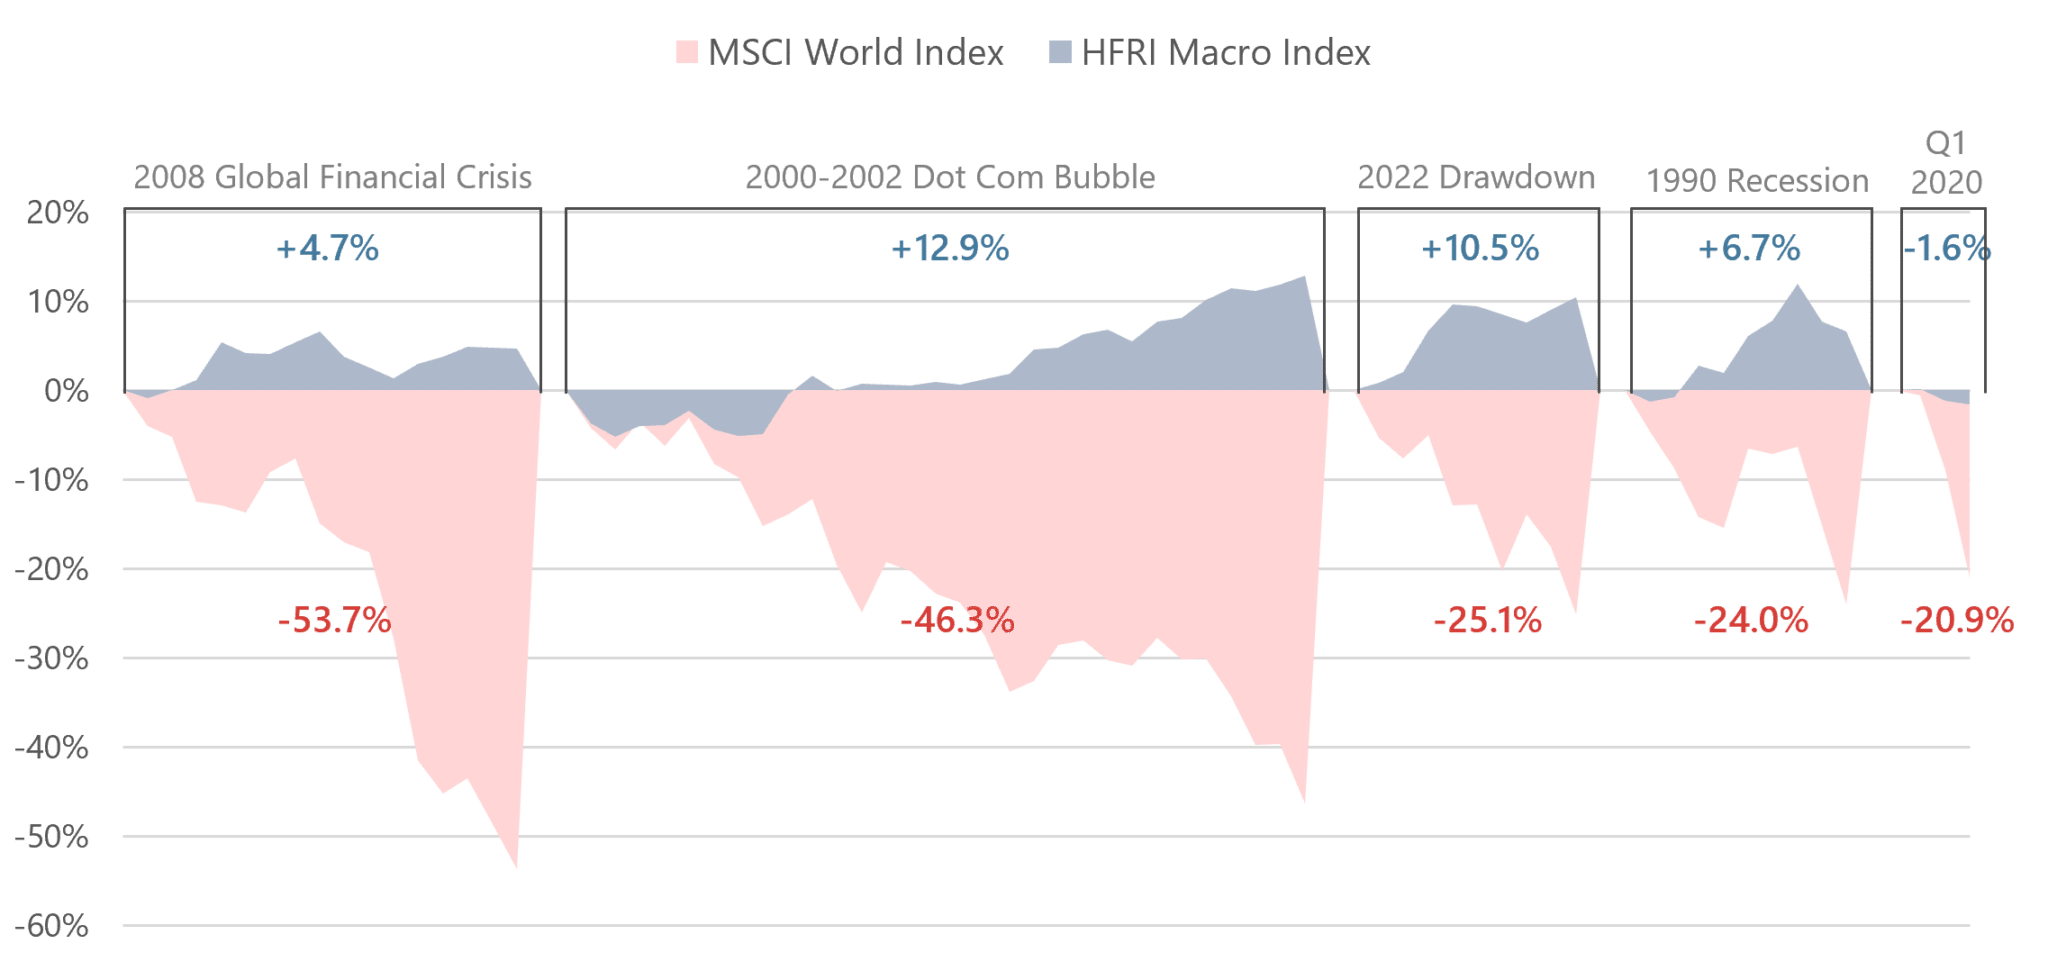
Since HFRI Macro Index Inception, Jan-90 to Dec-23
Data Source: eVestment, HFR, Inc. Chart by Graham Capital Management, L.P.
2022 Case Study
Many investors seek diversification through alternative strategies. However, diversification benefits vary significantly across styles, and many strategies have positive correlation during equity down markets. In 2022, markets experienced a trifecta of a selloff in equity and bond markets, elevated inflation, and increased market volatility, making it a difficult year for many investors. Amid the resultant dispersion in alternative investment styles, global macro and trend-following strategies emerged as notable winners in 2022.
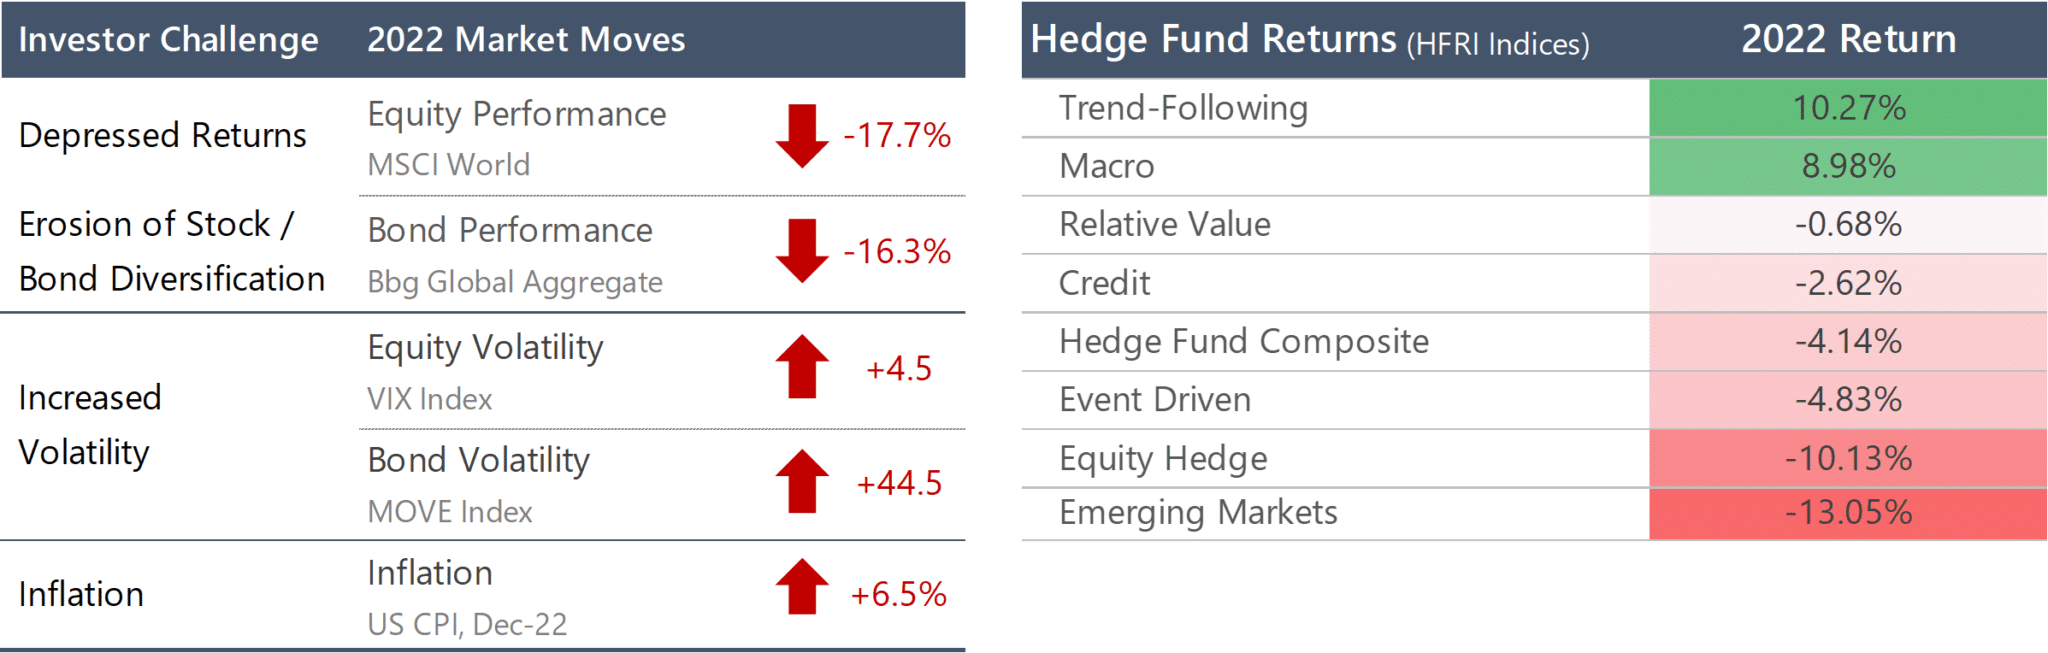
Data Source: eVestment, HFR, Inc. Chart by Graham Capital Management, L.P.
PERFORMANCE CHARACTERISTICS OF MACRO
The dynamic diversification features inherent in global macro strategies offer the potential for substantial alpha generation, especially during equity market downturns when diversification and returns uncorrelated to market beta are most crucial. This makes it an attractive complement to a traditional portfolio.
Summary Statistics: Significant Alpha Relative to Other Alternatives
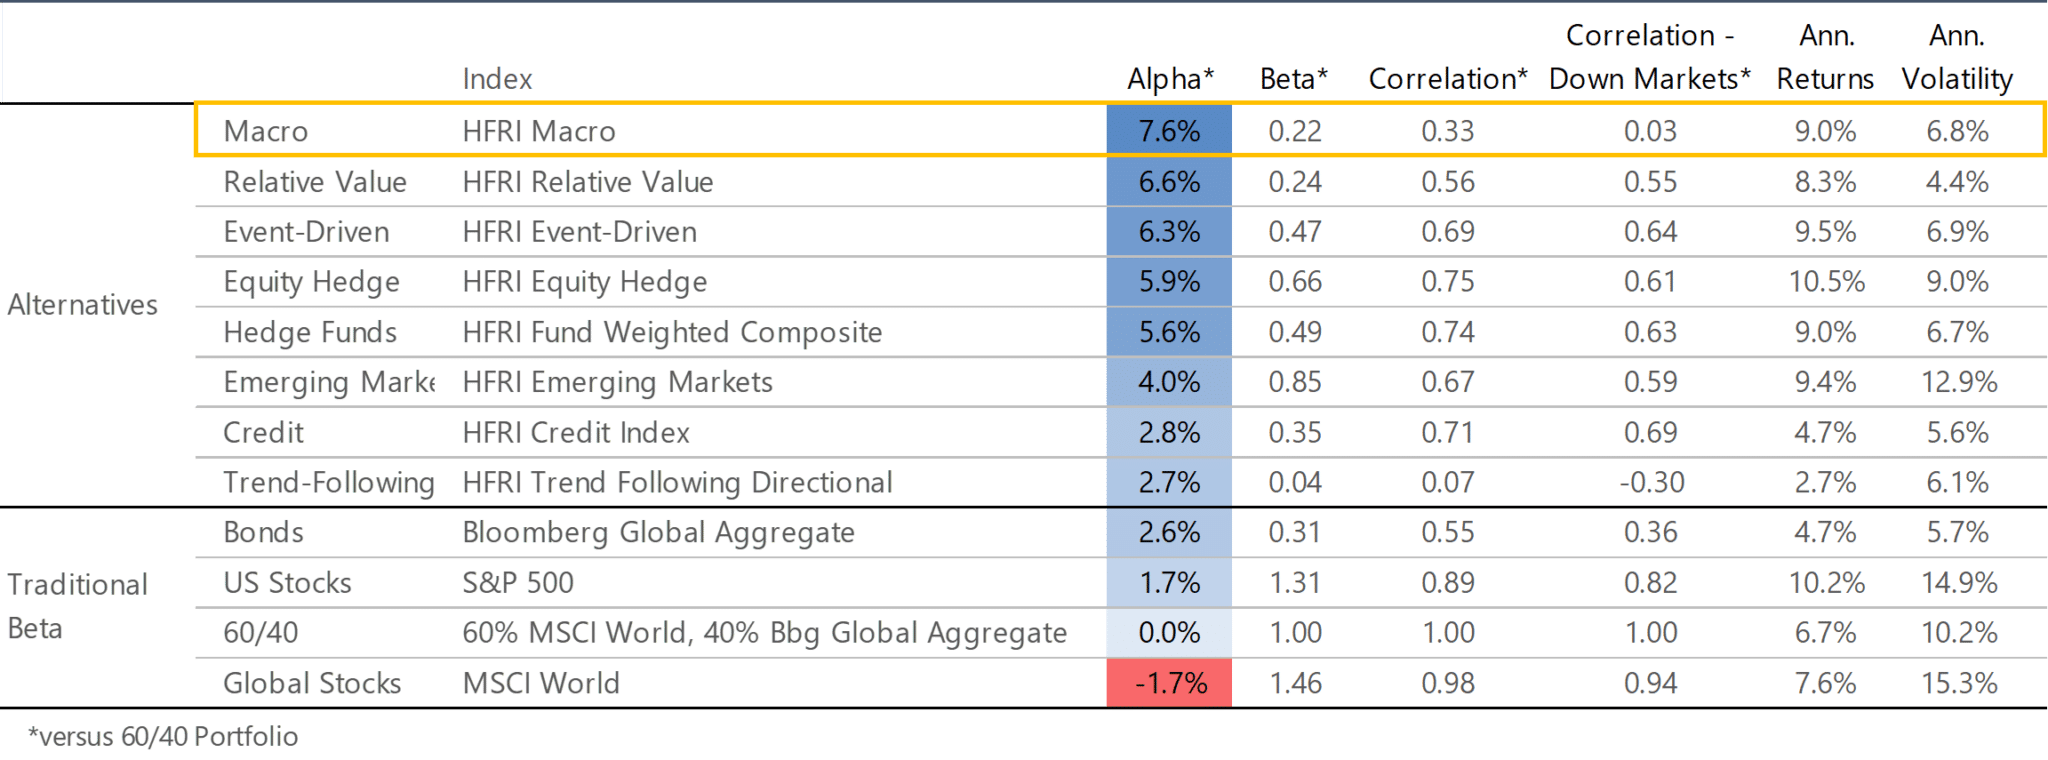
Since HFRI Macro Index Inception, Jan-90 to Dec-23
Data Source: eVestment, HFR, Inc. Chart by Graham Capital Management, L.P.
Hedge Fund styles are based on net performance of each respective HFRI Index from HFRI Macro index Inception in January 1990 to present, with the exception of the HFRI Trend Following Index and the HFRI Credit Index, which commence in January 2008.
Positive Skew
Macro tends to exhibit a positively skewed performance distribution. Positive skew is desirable because the strategy tends to exhibit more positive extremes than negative, with potentially many instances of smaller return periods in between. These positive extremes often occur when there are clear catalysts for directional market moves (which can be either bullish or bearish) and offer the potential to offset drawdowns elsewhere in a portfolio. In other words, macro can be a big contributor when the portfolio is under stress, and may not be a big drag during periods when the portfolio is performing well. This is true dynamic diversification.
Distribution of Returns
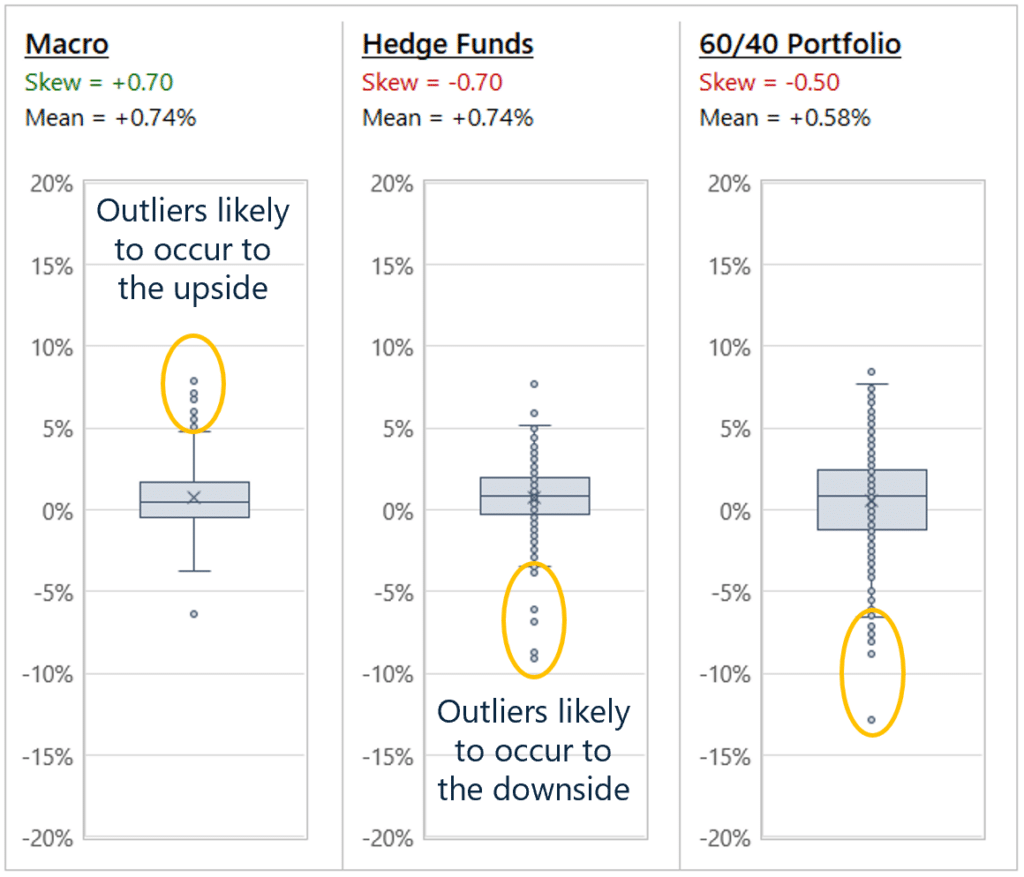
Since HFRI Macro Index Inception, Jan-90 to Dec-23; Macro and Hedge Funds are represented by the HFRI Macro Index and the HFRI Fund Weighted Composite Index, respectively.
Data Source: eVestment, HFR, Inc. Chart by Graham Capital Management, L.P.
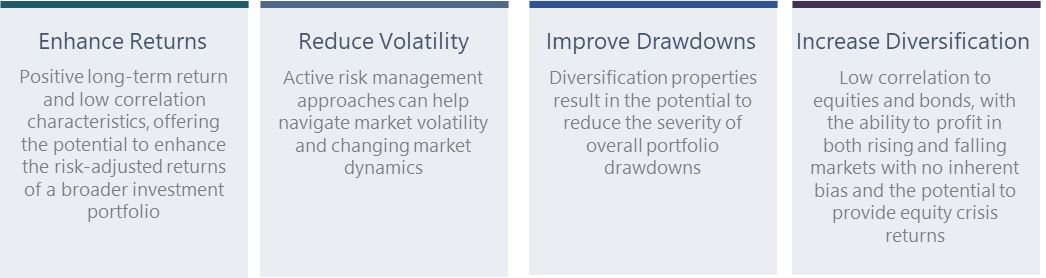
ROLE WITHIN AN INVESTMENT PORTFOLIO
Allocating to global macro as a long-term, strategic allocation within a diversified investment portfolio offers the potential for significant benefits and can be a valuable portfolio construction tool. Global macro offers the potential to lower the volatility and soften the drawdowns of a broader investment portfolio while adding to returns over the long run. Importantly, the strategy is meant to complement – rather than compete with – traditional investments.
Potential Impact of Allocating to Global Macro
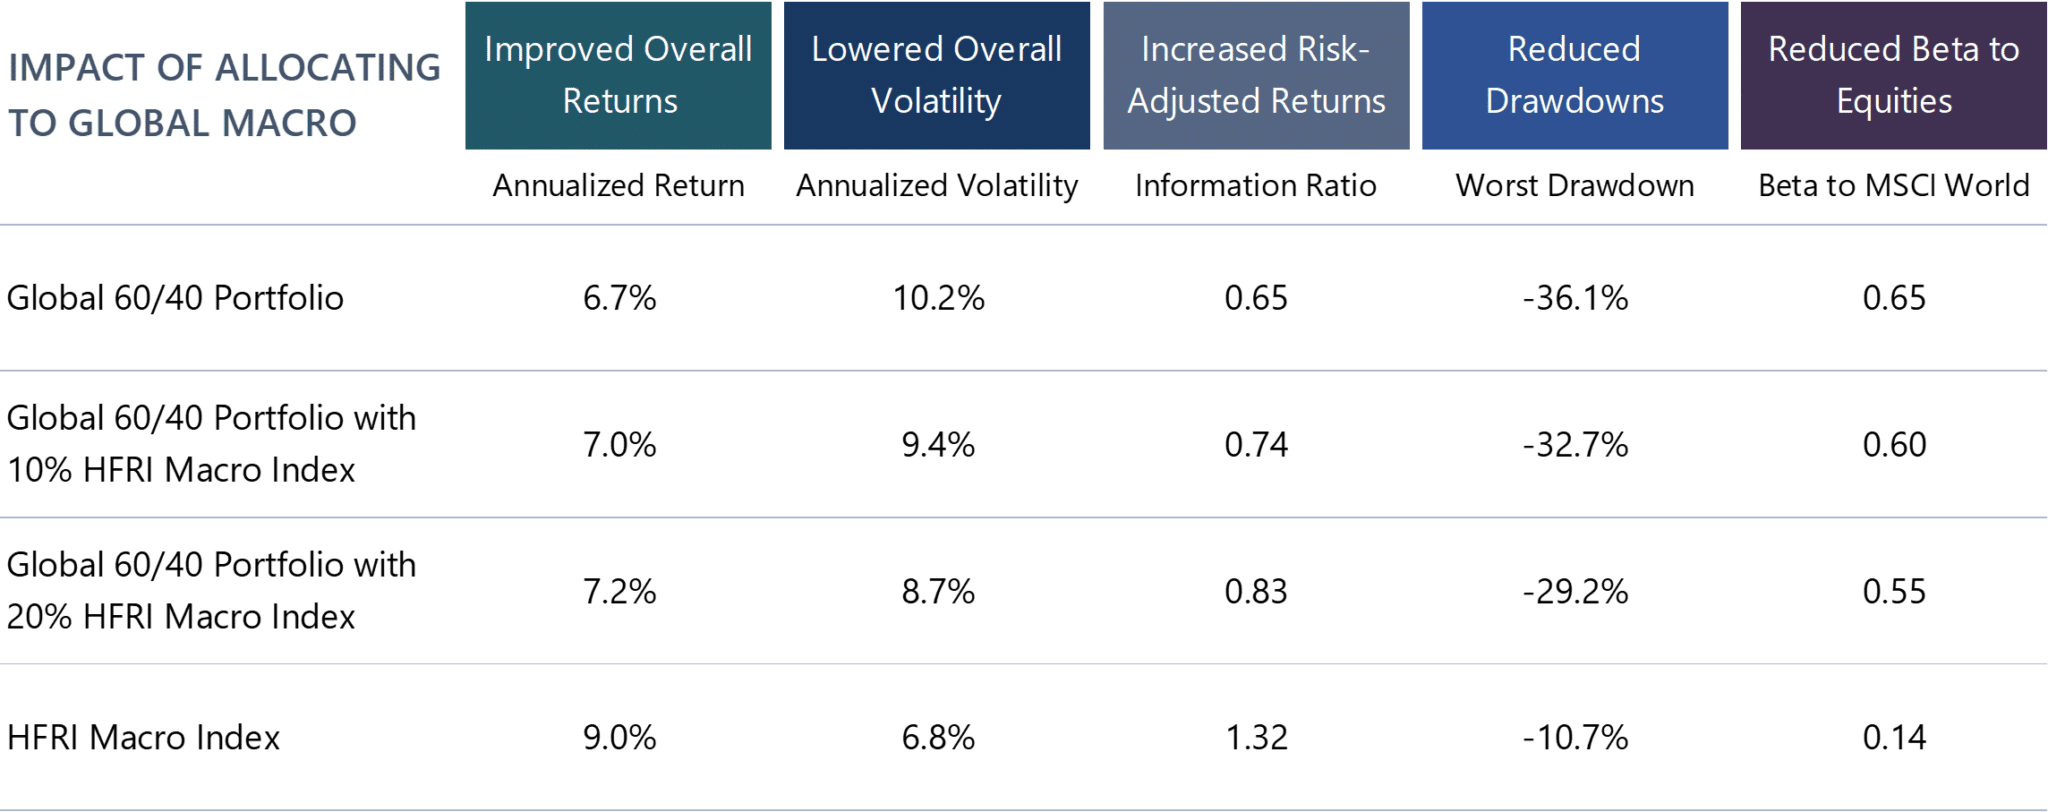
Since HFRI Macro Index Inception, Jan-90 to Dec-23
Global 60/40 Portfolio, Global 60/40 Portfolio with 10% HFRI Macro, and Global 60/40 Portfolio with 20% HFRI Macro are a hypothetical composite portfolios that are not investable. Please refer to important disclosures at the end of this presentation for details on how these portfolios were constructed and for important information regarding hypothetical performance.
Data Source: eVestment, HFR, Inc. Chart by Graham Capital Management, L.P.
IMPORTANT DISCLOSURE
Source of data: Graham Capital Management (“Graham”), unless otherwise stated
This document is neither an offer to sell nor a solicitation of any offer to buy shares in any fund managed by Graham and should not be relied on in making any investment decision. Any offering is made only pursuant to the relevant prospectus, together with the current financial statements of the relevant fund and the relevant subscription documents all of which must be read in their entirety. No offer to purchase shares will be made or accepted prior to receipt by the offeree of these documents and the completion of all appropriate documentation. The shares have not and will not be registered for sale, and there will be no public offering of the shares. No offer to sell (or solicitation of an offer to buy) will be made in any jurisdiction in which such offer or solicitation would be unlawful. No representation is given that any statements made in this document are correct or that objectives will be achieved. This document may contain opinions of Graham and such opinions are subject to change without notice. Information provided about positions, if any, and attributable performance is intended to provide a balanced commentary, with examples of both profitable and loss-making positions, however this cannot be guaranteed.
It should not be assumed that investments that are described herein will be profitable. Nothing described herein is intended to imply that an investment in the fund is safe, conservative, risk free or risk averse. An investment in funds managed by Graham entails substantial risks and a prospective investor should carefully consider the summary of risk factors included in the Private Offering Memorandum entitled “Risk Factors” in determining whether an investment in the Fund is suitable. This investment does not consider the specific investment objective, financial situation or particular needs of any investor and an investment in the funds managed by Graham is not suitable for all investors. Prospective investors should not rely upon this document for tax, accounting or legal advice. Prospective investors should consult their own tax, legal accounting or other advisors about the issues discussed herein. Investors are also reminded that past performance should not be seen as an indication of future performance and that they might not get back the amount that they originally invested. The price of shares of the funds managed by Graham can go down as well as up and be affected by changes in rates of exchange. No recommendation is made positive or otherwise regarding individual securities mentioned herein.
This presentation includes statements that may constitute forward-looking statements. These statements may be identified by words such as “expects,” “looks forward to,” “anticipates,” “intends,” “plans,” “believes,” “seeks,” estimates,” “will,” “project” or words of similar meaning. In addition, our representatives may from time to time make oral forward-looking statements. Such statements are based on the current expectations and certain assumptions of GCM’s management, and are, therefore, subject to certain risks and uncertainties. A variety of factors, many of which are beyond GCM’s control, affect the operations, performance, business strategy and results of the accounts that it manages and could cause the actual results, performance or achievements of such accounts to be materially different from any future results, performance or achievements that may be expressed or implied by such forward-looking statements or anticipated on the basis of historical trends.
Tables, charts and commentary contained in this document have been prepared on a best efforts basis by Graham using sources it believes to be reliable although it does not guarantee the accuracy of the information on account of possible errors or omissions in the constituent data or calculations. No part of this document may be divulged to any other person, distributed, resold and/or reproduced without the prior written permission of Graham.
INDEX DISCLOSURE
The below are widely used indices that have been selected for comparison purposes only. Indices are unmanaged, and one cannot invest directly in an index. Except for HFR indices, which do reflect fees and expenses, the indices do not reflect any fees, expenses or sales charges. Unlike most asset class indices, hedge fund indices included in this presentation have limitations, which should be considered in connection with their use in this presentation. These limitations include survivorship bias (the returns of the indices may not be representative of all the hedge funds in the universe because of the tendency of lower performing funds to leave the index); heterogeneity (not all hedge funds are alike or comparable to one another, and the index may not accurately reflect the performance of a described style); and limited data (many hedge funds do not report to indices, and the index may omit funds which could significantly affect the performance shown; these indices are based on information self-reported by hedge fund managers which may decide at any time whether or not they want to continue to provide information to the index). These indices may not be complete or accurate representations of the hedge fund universe and may be affected by the biases described above.
BLOOMBERG GLOBAL AGGREGATE INDEX: The Bloomberg Global Aggregate Index is a broad-based market capitalization weighted measure of the global investment grade fixed-rate debt markets. This multi-currency benchmark includes treasury, government-related, corporate and securitized fixed-rate bonds from both developed and emerging markets issuers. There are four regional aggregate benchmarks that largely comprise the Global Aggregate Index: The US Aggregate, the Pan-European Aggregate, the Asian-Pacific Aggregate and the Canadian Aggregate Indices. The Global Aggregate Index also includes Eurodollar, Euro-Yen, and 144A Index-eligible securities, and debt from five local currency markets not tracked by the regional aggregate benchmarks (CLP, MXN, ZAR, ILS and TRY).
HFRI MACRO INDEX: The HFRI Macro Index is a sub-index of the HFRI Fund Weighted Composite Index and is composite index of over 900 Investment Managers which trade a broad range of strategies in which the investment process is predicated on movements in underlying economic variables and the impact these have on equity, fixed income, hard currency and commodity markets.
HFRI TREND FOLLOWING DIRECTIONAL INDEX: The HFRI Trend Following Directional Index is a global, equal-weighted index of single-manager funds that report to the HFR Database. The HFRI Trend Following Directional Index is comprised of funds that employ trend following strategies such as Macro: Currency – Systematic, Macro: Systematic Diversified, certain Macro: Multi-Strategy funds and other Macro funds that utilize, to some degree, trend following.
HFRI RELATIVE VALUE INDEX: Investment Managers who maintain positions in which the investment thesis is predicated on realization of a valuation discrepancy in the relationship between multiple securities. Managers employ a variety of fundamental and quantitative techniques to establish investment theses, and security types range broadly across equity, fixed income, derivative or other security types. Fixed income strategies are typically quantitatively driven to measure the existing relationship between instruments and, in some cases, identify attractive positions in which the risk adjusted spread between these instruments represents an attractive opportunity for the investment manager. RV position may be involved in corporate transactions also, but as opposed to ED exposures, the investment thesis is predicated on realization of a pricing discrepancy between related securities, as opposed to the outcome of the corporate transaction.
HFRI EMERGING MARKETS INDEX: Emerging Markets funds invest, primarily long, in securities of companies or the sovereign debt of developing or ’emerging’ countries. Emerging Markets regions include Africa, Asia ex-Japan, Latin America, the Middle East and Russia/Eastern Europe. Emerging Markets – Global funds will shift their weightings among these regions according to market conditions and manager perspectives.
HFRI EVENT DRIVEN INDEX: Investment Managers who maintain positions in companies currently or prospectively involved in corporate transactions of a wide variety including but not limited to mergers, restructurings, financial distress, tender offers, shareholder buybacks, debt exchanges, security issuance or other capital structure adjustments. Security types can range from most senior in the capital structure to most junior or subordinated, and frequently involve additional derivative securities. Event Driven exposure includes a combination of sensitivities to equity markets, credit markets and idiosyncratic, company specific developments. Investment theses are typically predicated on fundamental characteristics (as opposed to quantitative), with the realization of the thesis predicated on a specific development exogenous to the existing capital structure.
HFRI CREDIT INDEX: HFRI Credit Index is a composite index of strategies trading primarily in credit markets. It is an aggregation of following 7 HFRI substrategy indices. HFRI ED: Credit Arbitrage Index, HFRI ED: Distressed/Restructuring Index, HFRI ED: Multi-Strategy Index, HFRI RV: Fixed Income-Asset Backed Index, HFRI RV: Fixed Income-Convertible Arbitrage Index, HFRI RV: Fixed Income-Corporate Index, and HFRI RV: Multi-Strategy Index.
HFRI EQUITY HEDGE INDEX: Investment Managers who maintain positions both long and short in primarily equity and equity derivative securities. A wide variety of investment processes can be employed to arrive at an investment decision, including both quantitative and fundamental techniques; strategies can be broadly diversified or narrowly focused on specific sectors and can range broadly in terms of levels of net exposure, leverage employed, holding period, concentrations of market capitalizations and valuation ranges of typical portfolios. EH managers would typically maintain at least 50% exposure to, and may in some cases be entirely invested in, equities, both long and short.
HFRI HEDGE FUND COMPOSITE INDEX: The HFRI Fund Weighted Composite Index is a global, equal-weighted index of single-manager funds that report to HFR Database. Constituent funds report monthly net of all fees performance in US Dollar and have a minimum of $50 Million under management or $10 Million under management and a twelve (12) month track record of active performance. The HFRI Fund Weighted Composite Index does not include Funds of Hedge Funds.
MSCI WORLD INDEX: A market cap weighted stock market index of 1,652 global stocks and is used as a common benchmark for ‘world’ or ‘global’ stock funds. The index includes a collection of stocks of all the developed markets in the world, as defined by MSCI. The index includes securities from 23 countries but excludes stocks from emerging and frontier economies.
S&P 500 TOTAL RETURN INDEX: An unmanaged, market value-weighted index measuring the performance of 500 U.S. stocks chosen for market size, liquidity, and industry group representation. Includes the reinvestment of dividends. The S&P 500 index components and their weightings are determined by S&P Dow Jones Indices.
60/40 PORTFOLIO or GLOBAL 60/40 PORTFOLIO: Reflects a hypothetical portfolio with a 60% allocation to equities and a 40% allocation to bonds as represented by the MSCI World Index and the Bloomberg Global Aggregate Index, rebalanced monthly. Performance of the underlying stock and bond indices is calculated on a gross basis. This is a hypothetical composite portfolio that is not investable. Please refer to important disclosures at the end of this document regarding hypothetical performance.
GLOBAL 60/40 PORTFOLIO WITH 10% HFRI MACRO: Reflects a hypothetical portfolio with a 54% allocation to equities as represented by the MSCI World Index, a 36% allocation to bonds as represented by the Bloomberg Global Aggregate Index, and a 10% allocation to Macro as represented by the HFRI Macro Index, rebalanced monthly. Performance of the underlying stock and bond indices is calculated on a gross basis. This is a hypothetical composite portfolio that is not investable. Please refer to important disclosures at the end of this document regarding hypothetical performance.
GLOBAL 60/40 PORTFOLIO WITH 20% HFRI MACRO: Reflects a hypothetical portfolio with a 48% allocation to equities as represented by the MSCI World Index, a 32% allocation to bonds as represented by the Bloomberg Global Aggregate Index, and a 20% allocation to Macro as represented by the HFRI Macro Index, rebalanced monthly. Performance of the underlying stock and bond indices is calculated on a gross basis. This is a hypothetical composite portfolio that is not investable. Please refer to important disclosures at the end of this document regarding hypothetical performance.
HYPOTHETICAL PERFORMANCE RESULTS HAVE MANY INHERENT LIMITATIONS. NO REPRESENTATION IS BEING MADE THAT ANY ACCOUNT WILL OR IS LIKELY TO ACHIEVE PROFITS OR LOSSES SIMILAR TO THOSE SHOWN. IN FACT, THERE ARE FREQUENTLY SHARP DIFFERENCES BETWEEN HYPOTHETICAL PERFORMANCE RESULTS AND THE ACTUAL RESULTS SUBSEQUENTLY ACHIEVED BY ANY PARTICULAR TRADING PROGRAM. ONE OF THE LIMITATIONS OF HYPOTHETICAL PERFORMANCE RESULTS IS THAT THEY ARE GENERALLY PREPARED WITH THE BENEFIT OF HINDSIGHT. IN ADDITION, HYPOTHETICAL TRADING DOES NOT INVOLVE FINANCIAL RISK, AND NO HYPOTHETICAL TRADING RECORD CAN COMPLETELY ACCOUNT FOR THE IMPACT OF FINANCIAL RISK IN ACTUAL TRADING. FOR EXAMPLE, THE ABILITY TO WITHSTAND LOSSES OR TO ADHERE TO A PARTICULAR TRADING PROGRAM IN SPITE OF TRADING LOSSES ARE MATERIAL POINTS WHICH CAN ALSO ADVERSELY AFFECT TRADING RESULTS. THERE ARE NUMEROUS OTHER FACTORS RELATED TO THE MARKETS IN GENERAL OR TO THE IMPLEMENTATION OF ANY SPECIFIC TRADING PROGRAM WHICH CANNOT BE FULLY ACCOUNTED FOR IN THE PREPARATION OF HYPOTHETICAL PERFORMANCE RESULTS AND ALL OF WHICH CAN ADVERSELY AFFECT ACTUAL TRADING RESULTS.
Stocks and bonds are represented by the MSCI World Index and the Bloomberg Global Aggregate Index, respectively, unless otherwise noted.
