ABSTRACT
Portfolio diversification is one of the most important and sought-after concepts in investing. A properly diversified portfolio will, on average, produce higher risk-adjusted returns than any single market investment, and has the potential to protect against drawdown exposure. However, due to market correlations, most investors realize a performance plateau, limiting the benefits of expanding a portfolio with additional markets. This market correlation structure can often make it difficult to achieve diversification.
1. INTRODUCTION
Markowitz was awarded the Nobel Prize in Economics in 1990 for his work on the theory of portfolio choice, first published in an essay entitled Portfolio Selection (Markowitz, 1952), and later, more extensively, in his book, Portfolio Selection: Efficient Diversification (Markowitz, 1959). This theory “analyzes how wealth can be optimally invested in assets which differ in regard to their expected return and risk”. Markowitz demonstrated that an investor can reduce overall levels of portfolio risk by investing in assets that are not perfectly correlated, in other words, by holding a diversified portfolio of assets.
Diversification is both observed and sensible; a rule
of behavior which does not imply the superiority of
diversification must be rejected both as a hypothesis
and as a maxim. (Markowitz, 1952)
Diversification has the potential to significantly improve portfolio returns and running a balanced and diverse portfolio is a goal of many investment strategies. However, the actual improvement an investor can expect to realize can be limited by a number of factors. In this brief paper we examine both the theoretical benefits of diversification as well as some of its practical limitations for strategies such as trend-following.
2. WHY DIVERSIFICATION IS IMPORTANT
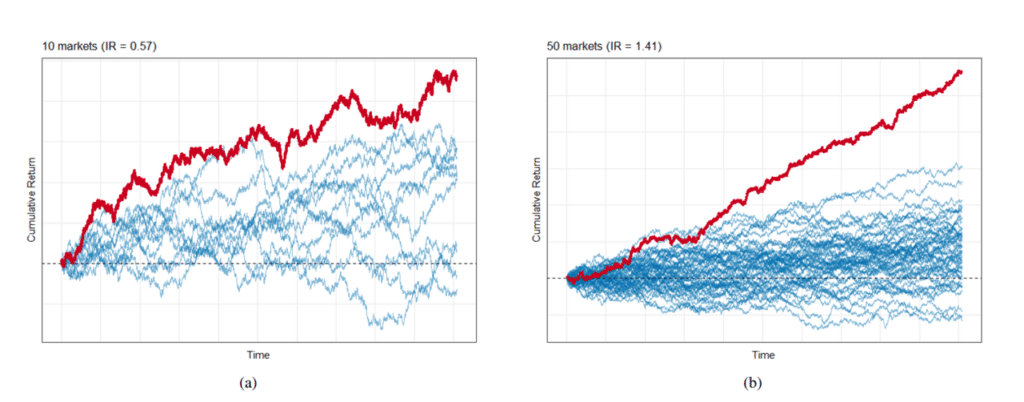
To illustrate how diversification can add value to a portfolio we can construct a simple simulation. We begin with a portfolio of 10 “assets”, each alone having modest performance (averaging a Sharpe ratio1 of 0.2). Using these 10 assets as building blocks, we can construct a simple equally weighted portfolio. Illustrated by the red line in Figure 1(a), we see that the portfolio has better performance (risk-adjusted returns) than any of its constituents. This is because we receive a diversification benefit, essentially “smoothing out” the returns of the portfolio. As the market universe is expanded, further improvement in risk-adjusted returns is served (Figure 1(b)-1(c)) as we receive additional diversification benefit.
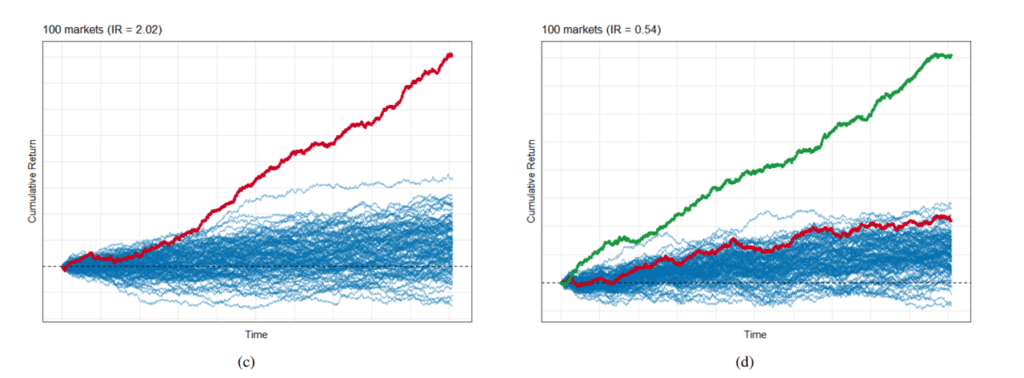
These results, while impressive, come with a significant caveat. The assets used in this simulation have, to this point, been uncorrelated to one another. If instead, we introduce a small amount of correlation (for example 10%) we observe a drastic reduction in performance. Figure 1(d) illustrates the impact of introducing correlation into the simulation by comparing the returns of uncorrelated markets (green line) and returns given a 10% correlation (red line). This simulation demonstrates that while diversification can significantly improve a portfolio of even modest constituents, it also demonstrates potential limits to this improvement due to market correlation.
Real markets are rarely uncorrelated. Markets, especially those within the same sector (e.g. fixed income, equities, etc.), often exhibit persistent positive correlations, and can move in the same direction at the same time. For example, the Dow Jones Industrial Average and the S&P 500 typically make or lose money on the same day (they have been 96% correlated for the past 20 years).
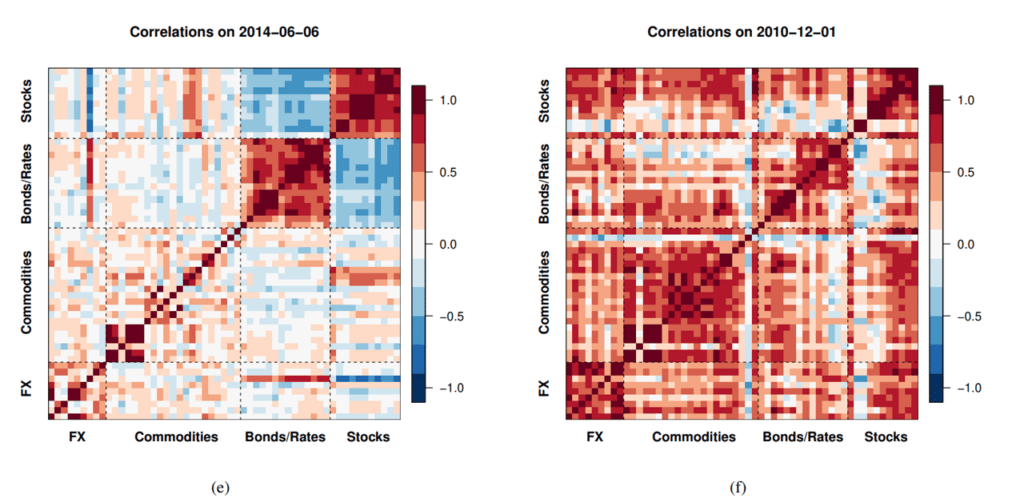
A convenient way to graphically represent correlations is to use a heatmap where colors are used to show the degree of correlation among assets. We provide some examples in Figure 1, which represent correlations between over 50 different macro assets. Figure 1(e) is characteristic of a more conventional market structure. We see relatively strong correlations (red hues) within sectors (e.g., stocks were positively correlated with other stocks), but relatively low correlations (blue hues) across sectors (e.g., stocks had low correlation with bonds at that time). However, correlations are rarely static for long. For example, during a period of market stress, such as initiations of the Fed’s quantitative easing (QE) policy, we observe strong alignment of markets and significant positive correlations both within and between sectors (Figure 1(f)). When these periods occur, the number of different assets held may provide less diversification than one hoped, regardless of the number of assets in the portfolio.
Figure 1. Adding uncorrelated assets increases portfolio diversification as noted with (a) 10 assets, (b) 50 assets, and (c) 100 assets. However, if there is a slight correlation (10%) then benefits of diversification are not as pronounced, with cumulative returns decreasing from the green line to the red line (d). However, the correlation across markets is dynamic, and can shift dramatically depending on the environment. In the heatmaps (e) and (f) red colors indicate a positive correlation (markets move together) and blue hues would indicate a negative correlation
2.1 IMPACT OF TREND FOLLOWING
As demonstrated in our previous simulation, diversification has the power to significantly enhance portfolio returns, but correlation can limit that enhancement. We have also observed that markets can exhibit significant positive correlation to one another, which is a important consideration when constructing a portfolio. There is an elegant mathematical result to outline the diversification benefit one should expect when adding markets to a portfolio.
We begin with a key statistical relationship: for a group of variables, the variance of their sum is equal to the sum of their covariances.

For our purposes, suppose we consider an equally weighted portfolio of n assets, Xi,

If we consider the case where the assets have equal risk (σ), and an average correlation of ρ (which is precisely the case we defined for our initial simulations), then equation (1), simplifies to:

Assuming a constant risk, as the number of assets get larger, the first term will become increasingly small and the second term will approach 1, thus we see asymptotic convergence:

If the markets are uncorrelated with ρ = 0, then Var(X¯) tends to 0, which leads to an increase in risk adjusted performance. If however, ρ > 0, after a certain point, as the number of assets within the portfolio continues to increase, the added benefit received becomes increasingly small, creating a ceiling effect.
We can demonstrate this effect in practice by simulating the construction of an expanding trend-following portfolio. We used the SG Trend Indicator2 to construct portfolios of increasing size, starting with a few of the most liquid markets and continuing to add markets in order of liquidity.
Initially, performance improves as the market universe increases (Figure 2), similar to the results observed earlier in our simulations. However, once the portfolio has reached between 40-60 markets, performance appears to saturate and there is little further improvement to be gained.
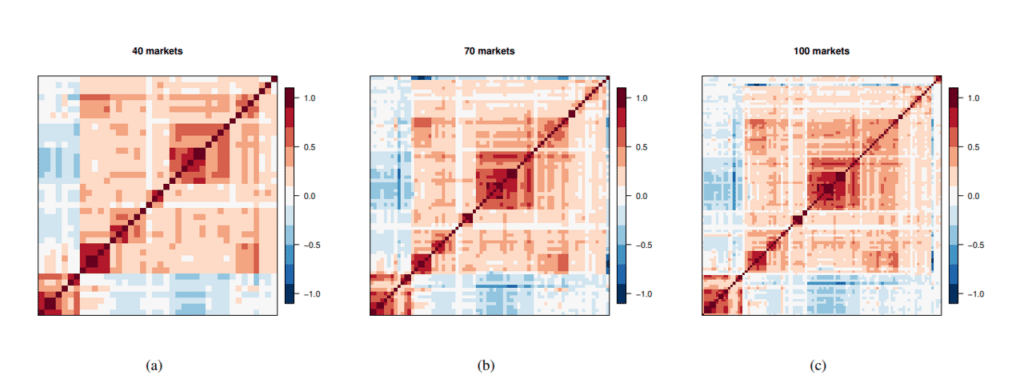
The reason for this lack of additional performance benefit is that simply adding markets does not necessarily lead to an increase in diversification. To visualize this, we observe in Figure 3, the correlation structure remains the same regardless of the number of markets added, suggesting that additional markets do not guarantee additional diversification.
Figure 2. As markets are added to a portfolio, the Sharpe ratio (y-axis) increases until approximately 50 markets have been added (x-axis), at which point, there is a performance ceiling such that adding additional markets does not provide additional performance.

Figure 3. Even though the number of markets included in the portfolio has more than doubled from (a) to (c), the correlation structures between the portfolios are virtually identical, suggesting that while adding additional markets may expand the portfolio, it does not necessarily add diversification.
3. CONCLUSIONS
Markowitz’s theory on portfolio construction and diversification rests on the concept that the level of risk in a portfolio can be reduced through the addition of assets that are not perfectly correlated. As a result one should expect to see improvement in risk adjusted returns. However, few markets move independently of one another and correlations between markets can be persistently high. As a result material diversification can be difficult to achieve. In particular, simply increasing the asset universe does not necessarily manifest in greater opportunities for diversification.
1The Sharpe ratio is used to analyze return while allowing for risk, and is defined as the average return divided by the standard deviation of return.
2We use the SG Trend Indicator, which is a market-based performance indicator designed to have a high and stable correlation to the returns of trend following CTA strategies. At its core, it uses a (20,120) moving average trading signal. For more details see https://cib.societegenerale.com/fileadmin/indices_feeds/SG_Trend_Indicator_Methodology_Summary.pdf
REFERENCES
H. Markowitz. Portfolio selection. The Journal of Finance, 7(1): 77–91, 1952.
H. Markowitz. Portfolio selection: efficient diversification of investments. Cowles foundation for research in economics at Yale university. Monograph. Wiley, 1959
LEGAL DISCLAIMER
THIS DOCUMENT IS NOT A PRIVATE OFFERING MEMORANDUM AND DOES NOT CONSTITUTE AN OFFER TO SELL, NOR IS IT A SOLICITATION OF AN OFFER TO BUY, ANY SECURITY. THE VIEWS EXPRESSED HEREIN ARE EXCLUSIVELY THOSE OF THE AUTHORS AND DO NOT NECESSARILY REPRESENT THE VIEWS OF GRAHAM CAPITAL MANAGEMENT. THE INFORMATION CONTAINED HEREIN IS NOT INTENDED TO PROVIDE ACCOUNTING, LEGAL, OR TAX ADVICE AND SHOULD NOT BE RELIED ON FOR INVESTMENT DECISION MAKING.
