Summary: We discuss an unexpected link between astrophysics and quantitative trading in our latest Quant Log. We explore the realm of Singular Value Decomposition (SVD), a robust matrix factorization tool, how SVD aids astrophysicists in unraveling cosmic enigmas, and SVDs role in extracting actionable insights from complex market data in quantitative trading.
Each night when you gaze into the starry night sky, you probably would not think that the method astrophysicists use to study the origin and early history of the universe has a stellar connection with how we endeavor to steadily grow our investors’ wealth at Graham.
In this Quant Log, we introduce Singular Value Decomposition (SVD), arguably the most widely used matrix factorization technique across all science and engineering fields. As a quantitative researcher with a background in gravitational-wave astrophysics, I have witnessed the prevalence and growing popularity of SVD in applications such as recommender systems, latent semantic analysis, political spectrum analysis, gene expression, and many more. Here, let’s turn the spotlight on two seemingly unrelated fields to appreciate the use of SVD: in astrophysics and in quantitative trading.
Astrophysics
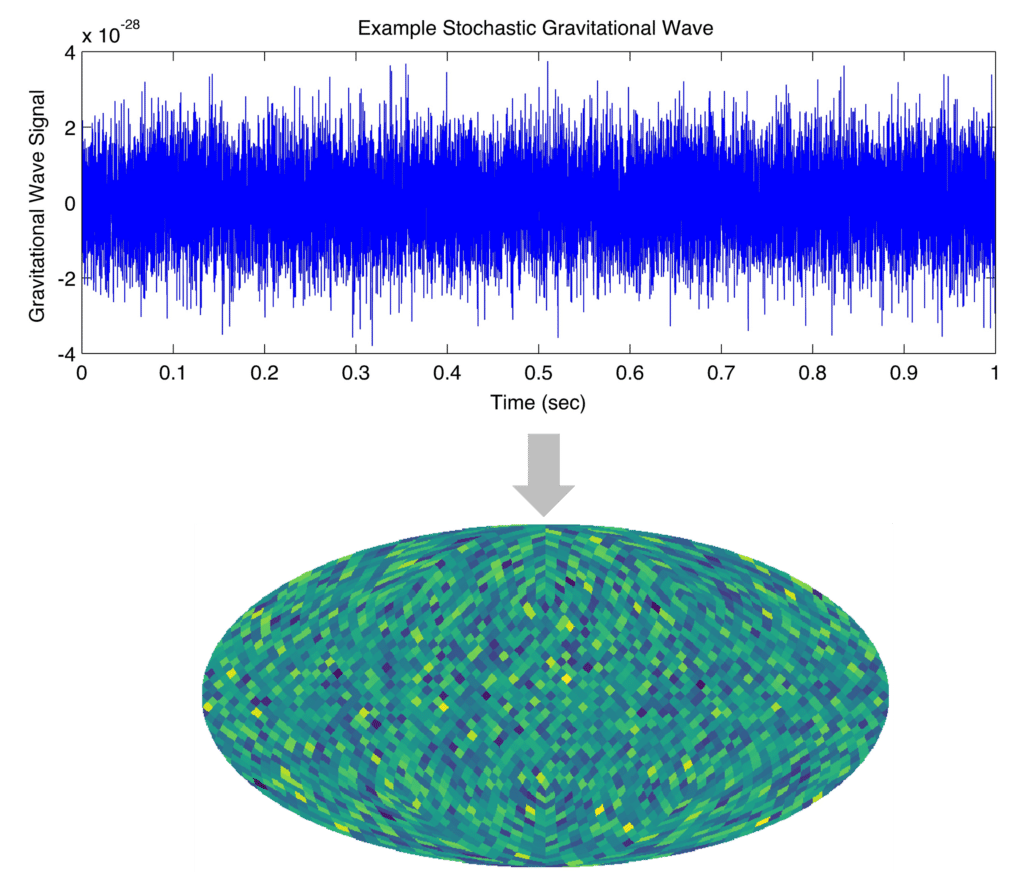
Suppose you have a network of gravitational wave interferometers, and suppose you want to detect the relic gravitational wave background coming from a 10^(-32) second after the Big Bang. However, the detector network, operated as a phased array, encodes the superposition of these sinusoidal plane waves from all directions in the sky into stochastic gravitational-wave time series. How do you then map the distribution of relic radiation from the Big Bang with such noisy time series? Via SVD! Along with the antenna patterns of these detectors, you can decode information from the Big Bang and discard unwanted noise from other sources using SVD. So, has LIGO detected the cosmological gravitational wave background after the first ever direct observation of gravitational waves in 2015? Spoiler alert: the LIGO Lab has yet to reach the sensitivity for a detection of any gravitational wave backgrounds.

Quantitative Trading
Like how astrophysicists decode the mystery of the universe using SVD, in quantitative trading, we often use Principal Component Analysis (PCA), which is just a special case of SVD applied to the data covariance matrix, to extract low-dimensional and efficient information from market data. PCA orthogonally projects noisy market data into a new coordinate system to identify a small number of principal components that explain most of the variation in the data. As a way of dimensionality reduction, we can then keep the first few dimensions and safely throw away the rest with minimal information loss. What’s neat here is that to implement PCA numerically, it is standard practice to compute the SVD of the data.
DISCLOSURE
This presentation includes statements that may constitute forward-looking statements. These statements may be identified by words such as “expects,” “looks forward to,” “anticipates,” “intends,” “plans,” “believes,” “seeks,” “estimates,” “will,” “project” or words of similar meaning. In addition, our representatives may from time to time make oral forward-looking statements. Such statements are based on the current expectations and certain assumptions of Graham Capital Management’s (“GCM”) management, and are, therefore, subject to certain risks and uncertainties. A variety of factors, many of which are beyond GCM’s control, affect the operations, performance, business strategy and results of the accounts that it manages and could cause the actual results, performance or achievements of such accounts to be materially different from any future results, performance or achievements that may be expressed or implied by such forward-looking statements or anticipated on the basis of historical trends.
This document is not a private offering memorandum and does not constitute an offer to sell, nor is it a solicitation of an offer to buy, any security. The views expressed herein are exclusively those of the authors and do not necessarily represent the views of Graham Capital Management. The information contained herein is not intended to provide accounting, legal, or tax advice and should not be relied on for investment decision making.
Tables, charts and commentary contained in this document have been prepared on a best efforts basis by Graham using sources it believes to be reliable although it does not guarantee the accuracy of the information on account of possible errors or omissions in the constituent data or calculations. No part of this document may be divulged to any other person, distributed, resold and/or reproduced without the prior written permission of GCM.

