Introduction
We have witnessed one of the fastest hiking cycles for the Federal Reserve in the last four decades, and a lot of developed market peers are following. In this analysis, we share some food for thought from a relative value perspective.
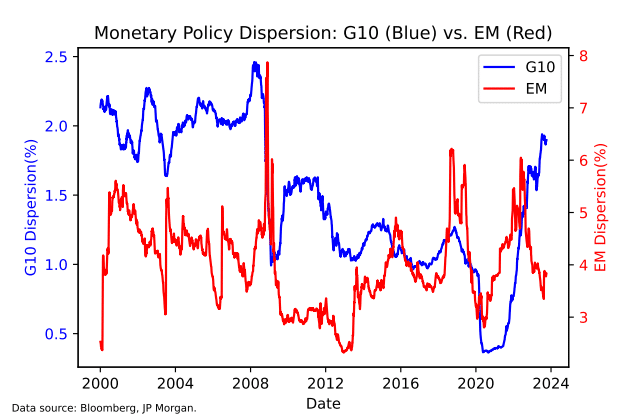
Let us introduce a concept called “dispersion”, which describes the magnitude of idiosyncratic moves of assets within a group. For a “relative value” strategy that seeks to profit from such opportunities, higher dispersion can be beneficial. We define monetary policy dispersion as the cross-sectional standard deviation of rates for a given group (G10, for example). Here we use 1Y swap rates, which are generally considered to be sensitive to monetary policy expectations.
Monetary Policy dispersion within G10 and EM
First, let’s focus on developed markets (G10, represented by the blue line). After a peak in dispersion during the Global Financial Crisis (GFC), dispersion dropped precipitously. The COVID crisis in 2020 sent dispersion to fresh lows as G10 central banks injected liquidity into the financial markets. However, the increase in dispersion since late 2021 suggests a regime change compared to most of the time post-GFC, with dispersion currently hovering around GFC peak levels. While there are numerous factors to consider in explaining this trend, these appear to be exciting times for investors as they navigate this period of strong dispersion.
Now, turning to emerging markets (EM, represented by the red line), it’s important to acknowledge that there are significant idiosyncratic differences among the countries typically classified within this category. However, for our analysis of monetary policy dispersion, it is worthwhile to consider them collectively. As expected, EM dispersion surged during the GFC. Interestingly, we never returned to that level of dispersion, even during events such as the taper tantrum, the COVID crisis, or recent tightening by G10 central banks. If anything, EM front-end rate dispersion has been declining, moving towards the mid-range of historical levels. Several factors may help explain this phenomenon: Inflation shocks have become more “business-as-usual” for EM central bankers over the past two decades, unlike their G10 counterparts. Furthermore, in recent years, some EM countries entered the hiking cycle earlier and have since started to cut rates.

Monetary Policy Dispersion and FX Carry Factor
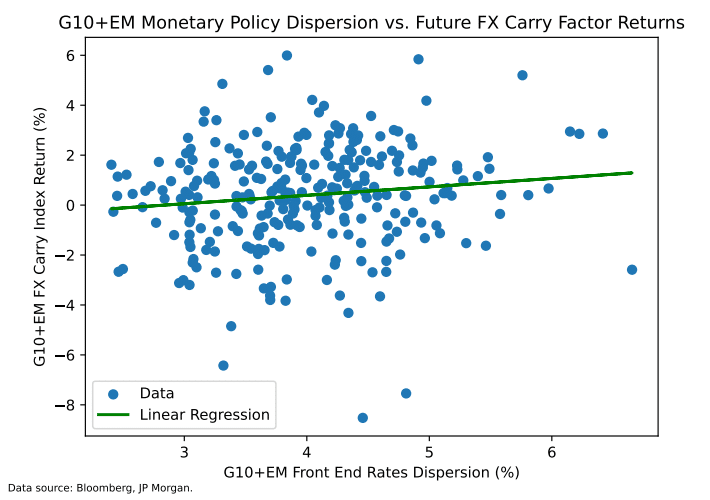
The next question that naturally arises is whether we can learn something about asset returns by looking at monetary policy dispersion. We specifically focus on FX, both due to its liquidity as an asset class and its sensitivity to policy rates. We utilize the Bloomberg FX carry index, which encompasses both G10 and selected EM, to illustrate how a traditional FX strategy performs under varying levels of rate dispersion.
The chart below shows front-end rate dispersions vs. FX carry factor returns one month into the future. A higher realized dispersion, in theory, should provide more room for a carry strategy (even a generic one) to do well. That is what we see. Such strategies need to be nimble to take full advantage of the rising dispersion.

DISCLOSURE
This presentation includes statements that may constitute forward-looking statements. These statements may be identified by words such as “expects,” “looks forward to,” “anticipates,” “intends,” “plans,” “believes,” “seeks,” “estimates,” “will,” “project” or words of similar meaning. In addition, our representatives may from time to time make oral forward-looking statements. Such statements are based on the current expectations and certain assumptions of Graham Capital Management’s (“GCM”) management, and are, therefore, subject to certain risks and uncertainties. A variety of factors, many of which are beyond GCM’s control, affect the operations, performance, business strategy and results of the accounts that it manages and could cause the actual results, performance or achievements of such accounts to be materially different from any future results, performance or achievements that may be expressed or implied by such forward-looking statements or anticipated on the basis of historical trends.
This document is not a private offering memorandum and does not constitute an offer to sell, nor is it a solicitation of an offer to buy, any security. The views expressed herein are exclusively those of the authors and do not necessarily represent the views of Graham Capital Management. The information contained herein is not intended to provide accounting, legal, or tax advice and should not be relied on for investment decision making.
Tables, charts and commentary contained in this document have been prepared on a best efforts basis by Graham using sources it believes to be reliable although it does not guarantee the accuracy of the information on account of possible errors or omissions in the constituent data or calculations. No part of this document may be divulged to any other person, distributed, resold and/or reproduced without the prior written permission of GCM.

