Q3 begins with geopolitics and monetary policy each presenting sources of uncertainty. The U.S.-Iran ceasefire in June reversed much of the spring energy shock, but July’s re-escalation showed that accessible onshore oil inventories remain low and that the conflict could easily slide into a full war again. At the same time, Chair Warsh’s first FOMC meeting reduced forward guidance and re-centered price stability. All of this results in a backdrop that combines resilient activity, high real rates, and wider event-driven tails.
The more durable change may be institutional. Markets are being asked to perform more price discovery and rely less on a pre-announced policy path, as the Fed’s reaction function has become less explicit, more conditional, and more dependent on incoming data. For investors, the likely result is greater volatility around economic releases, higher cross-market dispersion, and a wider gap between strong balance sheets and business models sustained primarily by leverage.
Key Takeaways
U.S. activity indicators were more resilient through Q2 than we expected in April, supported by continued household spending and rapid AI-related investment. We were too cautious on the near-term path, although renewed hostilities disrupting Middle East energy and shipping routes leave the second-half distribution unusually wide.
The first Warsh FOMC meeting marked a clear communications reset. Forward guidance was removed from the June statement, price stability became the central focus, and markets repriced a higher real-rate path. One meeting does not yet establish a durable regime, but the bar for preemptive intervention to support growth appears higher while inflation remains elevated.
Risk appetite remains strong but increasingly fragile, concentrated and debt financed. Korea’s leveraged semiconductor rally, the coexistence of tight high-quality credit spreads with mounting stress in lower-quality credit, and AI infrastructure’s growing reliance on debt financing have increased the market’s sensitivity to higher real rates and disappointing AI capex. Given crowded positioning in a narrow, dominant theme, any resulting adjustment could be amplified by position unwinds. Discretionary portfolios are run tactically, while systematic programs retain diversified, risk-targeted exposure.
U.S. Economic Resilience
U.S. activity indicators were more resilient through Q2 than we expected in April, supported by continued household spending and AI-related investment. The advance estimate of Q2 GDP will not be released until July 30, so our conclusion rests on data available through mid-July. The June CPI fell 0.4% month over month, the largest decline since April 2020, lowering year-over-year headline inflation to 3.5% from 4.2%; core CPI was 2.6% year over year and unchanged on the month, in a sharp downside surprise to consensus expectations. Energy fell 5.7% in June and accounted for most of the headline reversal. The June report confirms that the energy impulse can unwind quickly, but it does not settle the debate over underlying inflation, especially as the June moderation in core inflation came after a string of upside surprises.
We owe readers some honest scorekeeping, and this quarter it cuts in both directions. In April, we argued that the balance of risks had shifted decisively toward a slower, more fragile U.S. economy in the second half, driven by a possible convergence of private-credit tightening, AI-led hiring weakness, and a capex pause. That convergence was not evident in Q2. Activity indicators, household spending, and the technology capital cycle were firmer than we expected. A domestic rollover scenario now carries a lower probability, and we will be looking for clearer confirmation thresholds in labor and credit data.
The spring increase in headline inflation was dominated by the energy shock, while tariff-sensitive goods and selected services were already running above the Fed’s comfort zone. June demonstrated how rapidly the headline impulse can reverse when energy prices fall, but it did not settle the core inflation debate. What the episode did validate was our January argument about the distribution, rather than the precise path: medium-term inflation compensation assumed a relatively clean return to target despite energy and geopolitical risk, and convex protection paid off. The steepeners did not. The 2s/10s curve peaked above 70 basis points in February and flattened below 30 by late June as front-end hawkish repricing outpaced the long end. Gold fell roughly 11%, behaving primarily as a rate-sensitive asset during the shock.
The June employment report was compositionally weak. Payrolls rose 57,000; April and May were revised lower by a combined 74,000; participation fell to 61.5%; and household employment declined. BLS nevertheless noted that the payroll gain was close to the average monthly increase over the preceding year, while month-to-month household estimates are unusually noisy. We therefore read June as consistent with a still-resilient labor market, not yet as proof of contraction. The second-half question is whether subsequent reports confirm weaker labor demand, narrower payroll breadth, and further declines in participation and household employment.
Oil: Thin Buffers Behind the Glut Narrative
For most of Q2, the market moved from scarcity to prospective surplus as Gulf traffic recovered and crude accumulated at sea. Front-month WTI and Brent futures fell rapidly as negotiations advanced and alternative export routes, floating storage, and more price-sensitive Chinese buying reduced the immediate scarcity premium. That did not mean physical buffers had been rebuilt. IEA data show that observed global inventories rose by 21 million barrels in June because oil on water increased, while OECD inventories fell by 62 million barrels and non-OECD crude stocks declined by 37 million barrels, led by China. The distinction between floating barrels and accessible onshore stocks is central to the Q3 risk.
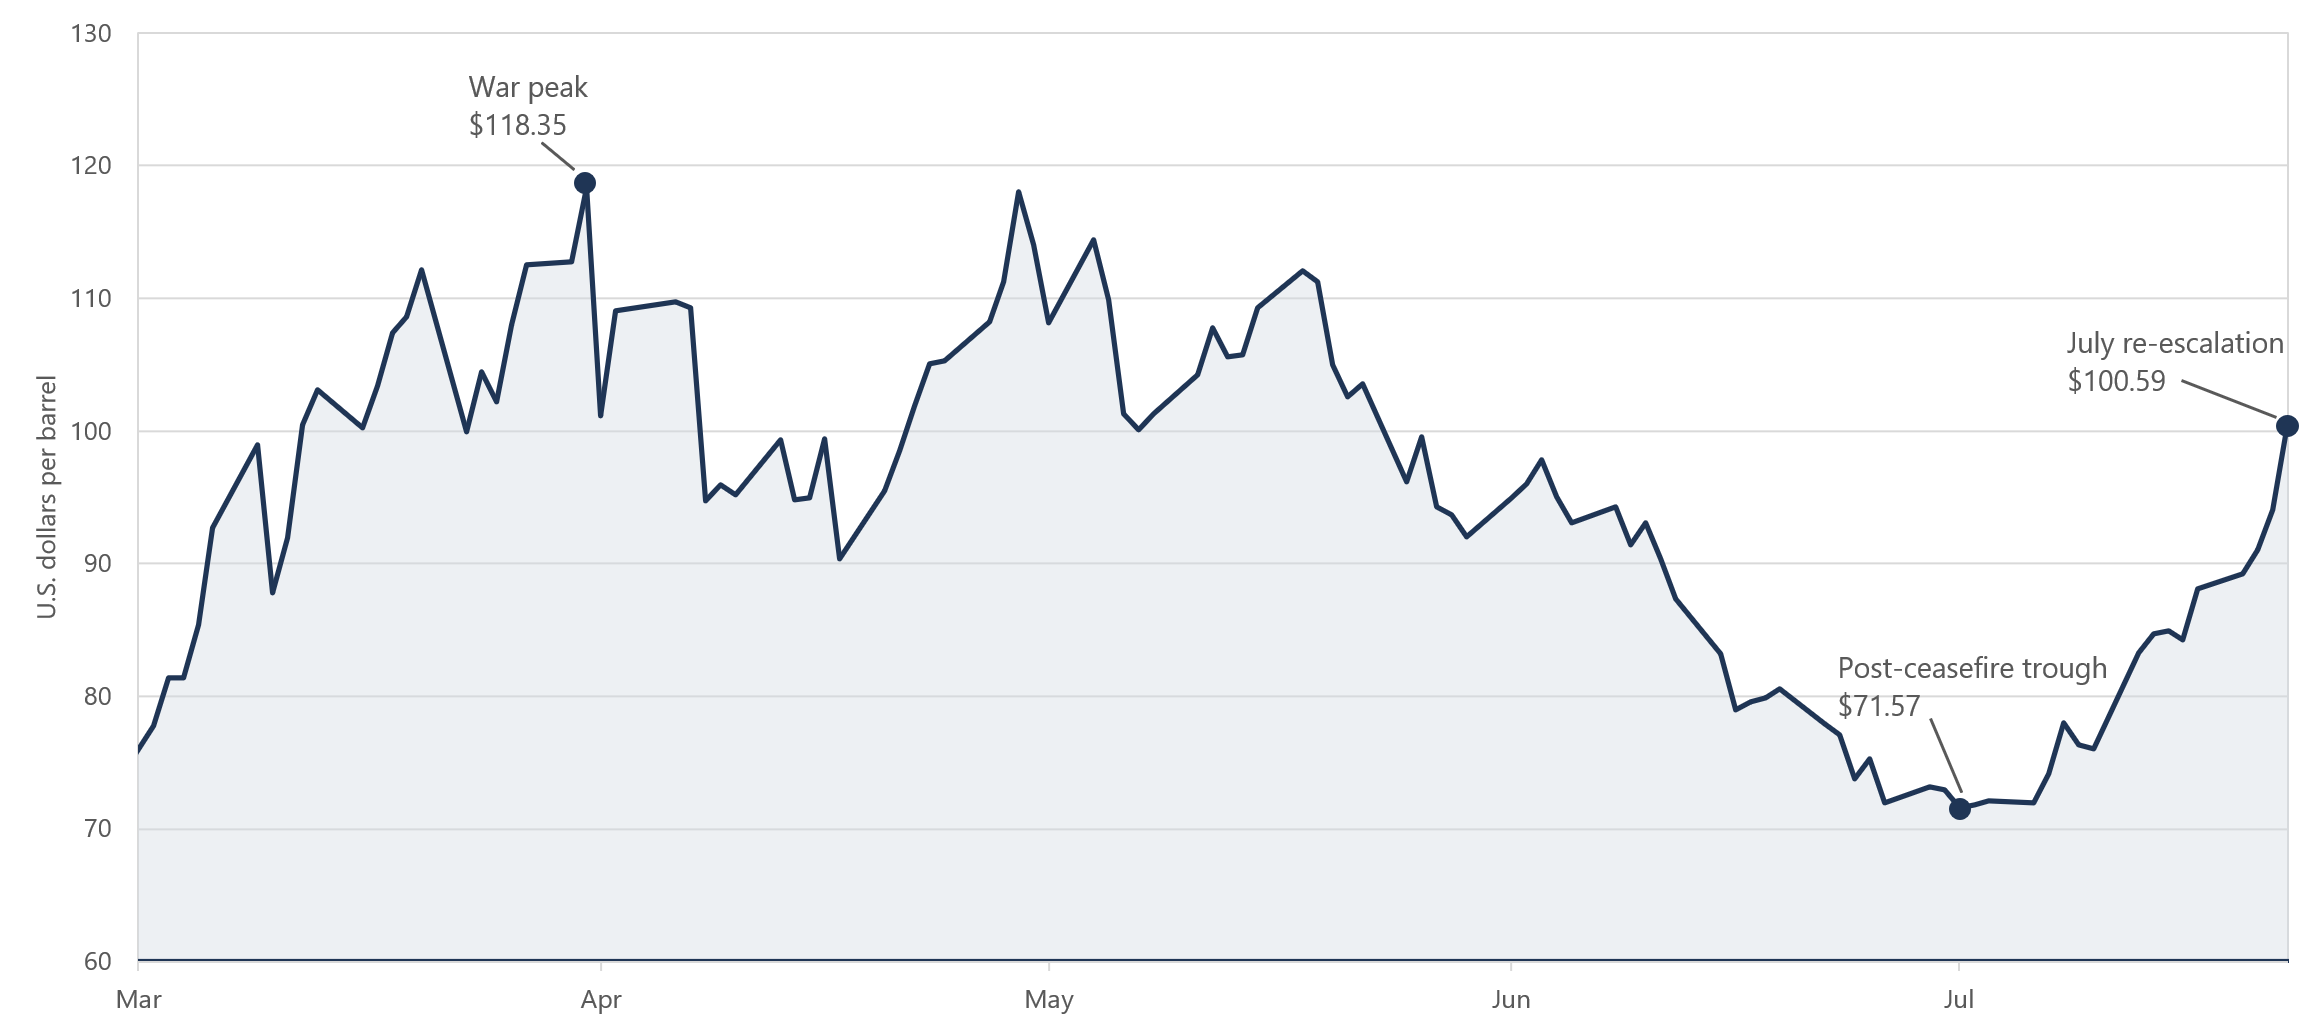
July’s renewed disruption to the flow of goods through the Strait of Hormuz hit a market with more oil at sea but thinner onshore cushions than the headline inventory total suggested. After trading above $90 through much of the spring, Brent retreated in June as negotiation signals emerged, before breaking $100 in late July as risks to regional shipping broadened. Front-month pricing no longer reflects a benign outcome, but the curve may still underprice the duration of physical disruption. While U.S.-Iran strikes have once again paused at the time of this writing, a lasting settlement is still not visible on the horizon.
While incentives for both sides to return to the table remain – ahead of the midterms, the U.S. administration wants lower oil prices, while Tehran has an economic incentive to restore export revenue under sanctions relief – a military escalation remains a real possibility. This would be a worrying outcome for the global economy and has the potential to move market prices significantly. The key market question today is whether asset prices adequately reflect the risk of an extended disruption to goods from the Gulf states given depleted onshore inventories. The distribution of outcomes is wide, and the situation remains highly fluid, which needs to be reflected in the way we manage positions.
Brent Crude: From War Peak to Renewed July Escalation
Brent Crude Spot Price: War Peak, Post-Ceasefire Trough, and July Re-escalation. Data through July 23, 2026. Sources: U.S. Energy Information Administration and Bloomberg; chart by Graham Capital Management.
The Warsh Fed: Breaking the Feedback Loop
The June 17 FOMC meeting marked a material communications reset. The Committee voted 12-0 to hold the target range at 3.50-3.75% and removed forward guidance from the policy statement. However, the median of participants’ projections implied a 2026 increase, with nine members projecting at least one increase. Although Warsh did not submit a dot, he focused almost exclusively on too-high inflation in the press conference. The market acknowledged the hawkish tilt of the meeting and the press conference. Going forward, the questions are whether Warsh will follow up his hawkish tone with rate hikes and what lasting changes the five task-force reviews produce to communications, balance-sheet implementation, and the inflation framework. One meeting is evidence of an emerging regime, not yet proof of a settled one. Warsh reinforced the hawkish message in his July semiannual testimony, emphasizing that the Committee has “no tolerance for persistently elevated inflation” and that price stability is the precondition for sustained growth. That language raises the bar for easier policy and suggests that the Warsh Fed may be quicker to tighten rates. A September hike remains live but is conditional on resilient activity and renewed evidence of underlying inflation persistence.
Chairman Warsh’s preference for reduced forward guidance restores a larger role for financial markets as a mechanism for price discovery. Less prescriptive guidance can improve information content and efficient capital allocation, but it can also raise near-term volatility and increase the cost of policy mistakes. The five task forces – communications, balance sheet, data, productivity and labor, and inflation – are the mechanism through which Warsh intends to test that trade-off. Findings from the task force are expected by the end of 2026.
The strongest critique of a large central-bank balance sheet is not that reserves mechanically translate into bank lending. Since the Fed began paying interest on reserves, reserves have functioned more like overnight government liabilities, and QE has operated primarily through duration removal and maturity transformation. The relevant questions are whether duration removal compresses term premium, whether an ample-reserves regime changes the maturity profile and fiscal sensitivity of the consolidated public balance sheet, and whether repeated market-functioning interventions create dependence on central-bank liquidity and weaken incentives for prudent risk management. By replacing fixed-rate term liabilities with liabilities that reprice at the front end, the consolidated sovereign balance sheet acquired more of the inverse-floater profile we have discussed elsewhere, that is, a balance sheet more exposed to rising short-term rates because its funding costs reprice faster than the returns on its longer-duration assets. These are questions about pricing, fiscal exposure, and market structure – not a simplistic claim about ’printed money’.
Those questions become more complicated in a crisis, when intervention risks appearing to finance the government. One of the Fed’s core crisis functions is to serve as lender of last resort and preserve market functioning. A generic funding squeeze would likely be easier to address. A harder case would be Treasury-market dysfunction following a failed or severely tailed auction. The Fed could support market functioning through secondary-market purchases, repo facilities, or other liquidity tools; it could not directly absorb incremental issuance by bidding competitively at the Treasury auction. Such intervention could nevertheless be perceived as monetization at a moment of fiscal stress – exactly the perception a credibility-focused Chair would want to avoid. Stress in nonbank credit markets creates a similar timing problem. The key questions are whether the new framework preserves the Fed’s capacity to respond in a crisis and whether a less prescriptive Fed can distinguish ordinary repricing from genuine market dysfunction quickly enough to act when liquidity disappears.
Guidance on the timing of changes to the balance sheet by the chair offers important context for the pace of change. Warsh’s reference to nearly two decades of balance sheet growth and promise that change would be “previewed, explained and debated well before it happens” point to a slow-moving theme, rather than shock therapy.
In the debate of the impact of AI on productivity and the labor market, the narrative seems to be that the new Chair is biased towards assuming that the technology will cool inflation. The opposite is also plausible: a productivity boom could lift the neutral rate by raising returns on capital. Strong economic growth and higher expected returns on capital could anchor borrowing costs at a higher level.
One additional institutional development deserves mention. The Supreme Court left in place the injunction preventing Governor Lisa Cook’s removal while litigation proceeds. The decision preserves meaningful statutory and procedural constraints around the attempted removal, but it does not finally resolve the underlying facts, the ultimate merits, or the broader constitutional status of the Fed’s removal protections. At the margin, it reduces an immediate threat to institutional continuity without settling the larger independence debate. We would note that the decision was narrow in procedural posture, that the Court was divided 5–4, and the Fed’s broader regulatory authority remains exposed to political pressure.
What the Rates Market Is Telling Us
The rates market has been unusually articulate this quarter, but reading it correctly requires keeping three components separate:
The near-term inflation path, which energy moved violently;
Medium-term market inflation compensation, which remained comparatively stable and later moved lower; and
The expected real policy path and model-estimated term premium, where much of the quarter’s repricing occurred.
Kept separate, the quarter’s apparent paradox – an initial inflation shock that ends with lower breakevens and sharply higher real yields – resolves itself.
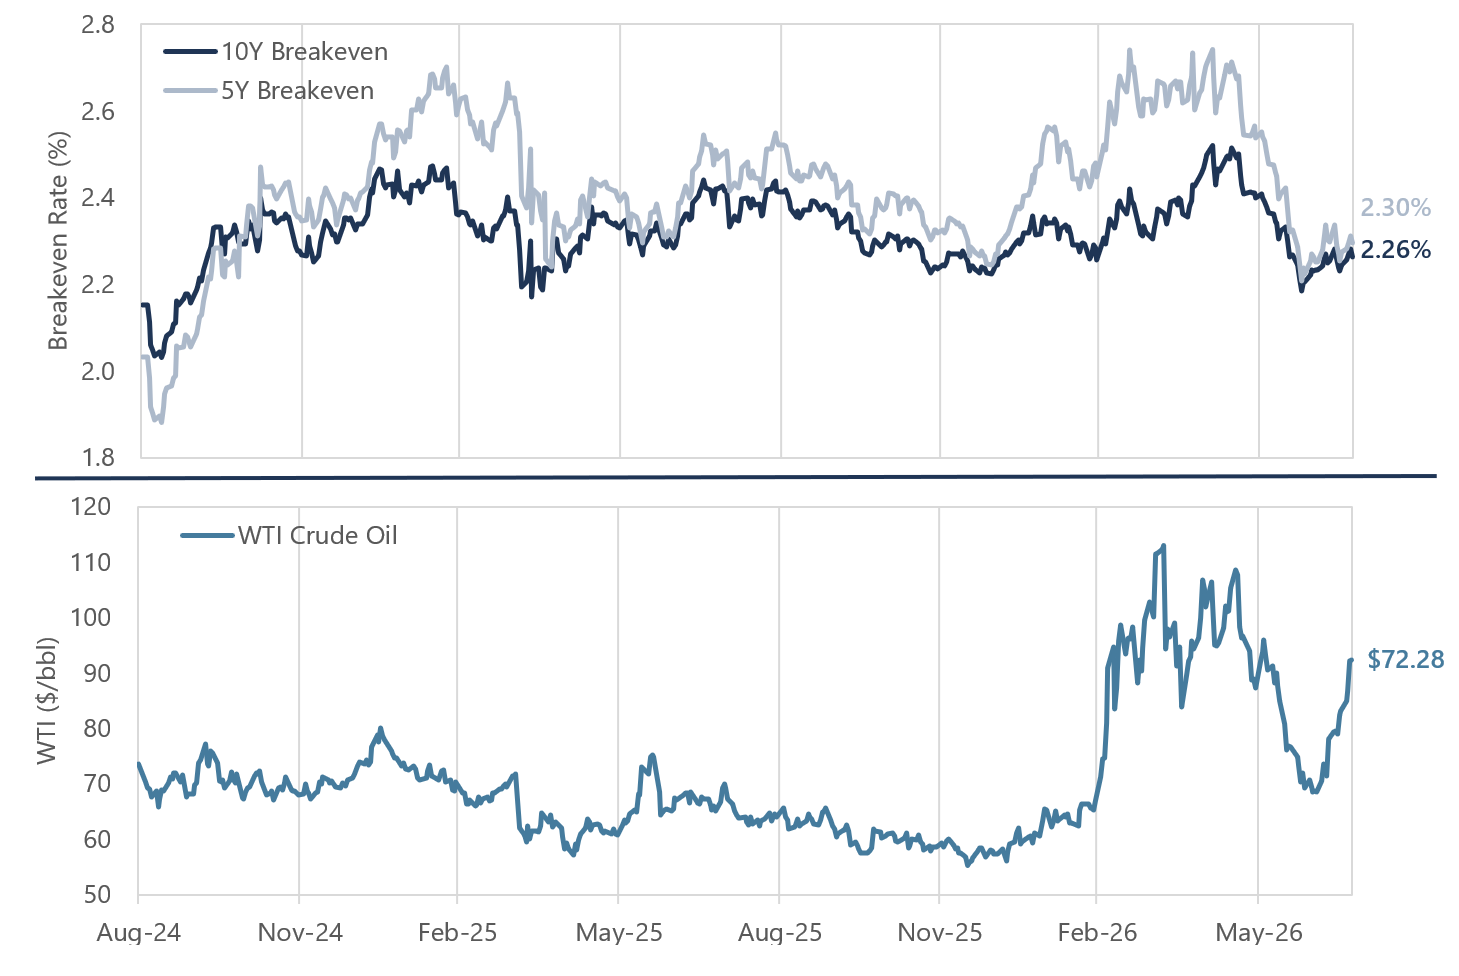
Start with what the war did and did not do. It repriced the near-term path more than the medium-term anchor. Five-year breakevens – more sensitive to spot energy – rose from roughly 2.4% to about 2.75% as WTI moved from the low $60s to above $110, while ten-year breakevens peaked near 2.55%. The market demanded more inflation compensation over the next five years than over the full decade. The conclusion is that medium-term market inflation compensation remained comparatively stable even as near-term energy risk surged.
Breakeven Inflation and Oil: Near-Term Shock, Stable Forward Compensation
5-Year and 10-Year Breakeven Inflation Rates and WTI Crude. Data through June 30, 2026. Source: Bloomberg; Chart by Graham Capital Management.
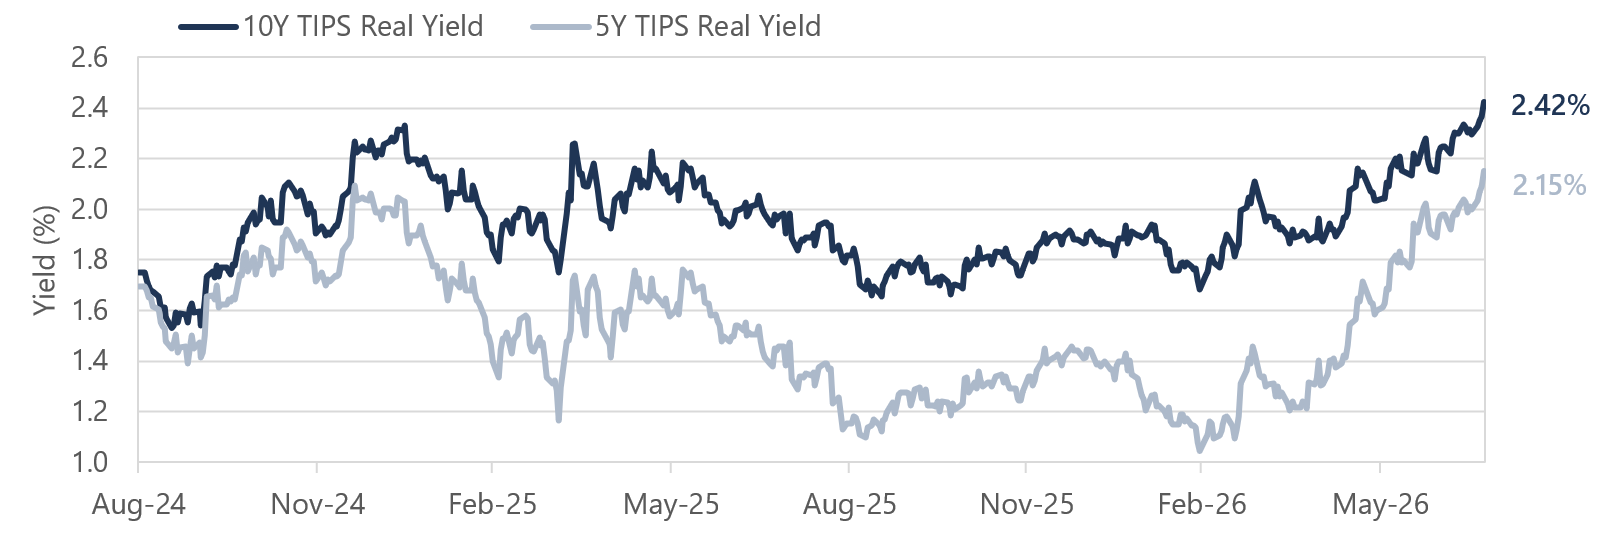
The real-yield curve is where the broader repricing registered. Five-year real yields entered the war near the low end of their two-year range, around 1.1%, while markets still carried 2026 easing. As cuts were removed and pricing shifted toward a firmer real policy path, five-year real yields rose and the real curve flattened. At the same time, model-estimated ten-year term premium increased. The combination is consistent with front-end reaction-function repricing overwhelming the duration-risk move at the long end. The bear flattening was therefore predominantly a repricing of the Fed reaction-function, not exclusively a duration event – a form of carry destruction that can stress the inverse-floater economy.
Higher Real Yields, Lower Inflation Compensation
5-Year and 10-Year TIPS Real Yields. Data through June 30, 2026. Source: Bloomberg; Chart by Graham Capital Management.
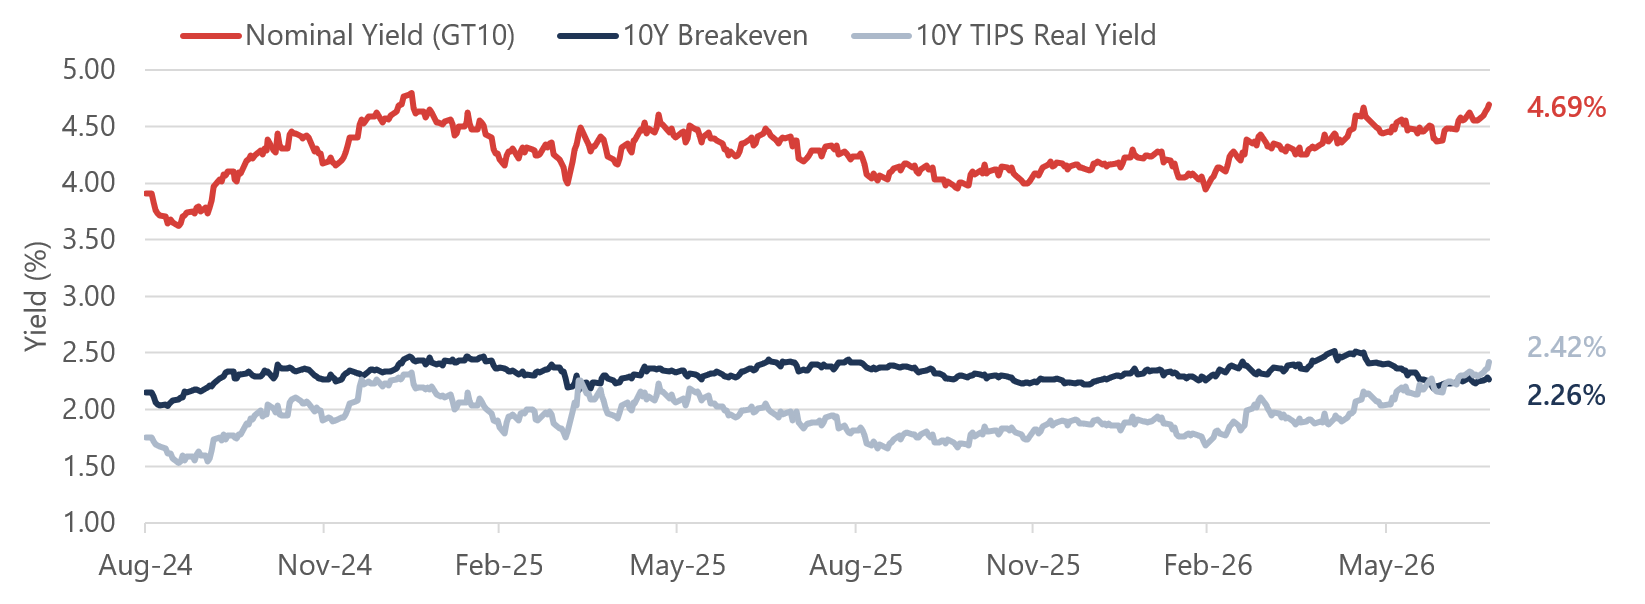
June and July added three observations. First, five-year breakevens more than round-tripped the war as oil retreated, while real yields continued to rise, a move consistent with a firmer expected real policy path but one that cannot be attributed to Warsh alone. Second, five-year inflation compensation moved toward the low end of its recent range. That supports the view that the medium-term anchor held, but it is not proof that the anchor itself changed as risk and liquidity premia are included. Third, the rise in the ten-year nominal yield this year has come predominantly through the real-yield component. As of July 16, five- and ten-year TIPS yields were 2.04% and 2.35%, respectively, while the nominal ten-year yield was 4.57%. Higher real rates are one channel through which a firmer Fed reaction function should tighten financial conditions, particularly for leveraged and long-duration balance sheets.
10-Year Treasury Yield Decomposition: Real Yield and Breakeven Inflation
10-Year Nominal Treasury Yield, Breakeven Inflation Rate, and TIPS Real Yield. Data through June 30, 2026. Source: Bloomberg; Chart by Graham Capital Management.
The repricing across the real yield curve is informative because it is consistent with some combination of a higher expected real policy path, a higher expected neutral rate, and a higher real term premium.
The removal of forward guidance from the June statement will likely increase volatility around data releases and FOMC meetings as markets infer the Fed’s reaction function in real time. That makes policy uncertainty more directly priced. For positioning, we have shifted from curvature toward smaller, tactical outright expressions.
Risk Appetite and the Widening Delta
If the rates market has been disciplined, parts of the risk complex have been more permissive. Higher real rates have had limited aggregate impact on equity indices, especially long-duration growth equities, because earnings expectations and AI investment have continued to offset discount-rate pressure. Financial conditions eased over the quarter even though policy did not. The record-scale SpaceX IPO and its subsequent sharp drawdown are evidence of both extraordinary risk-bearing capacity and valuation fragility; they are not, by themselves, a mechanical cycle-top signal. The productivity question remains open, and the dispersion between companies that can monetize AI investment and those that cannot is likely to widen.
The clearest example is the Korean semiconductor complex. The market capitalization of 16 domestic single-stock leveraged products rose from KRW 4.4 trillion on May 27 to KRW 11.9 trillion by July 15, while Samsung Electronics and SK Hynix together reached 52% of KOSPI capitalization. Regulators subsequently suspended new listings and tightened investor-protection requirements. Concentration and daily rebalancing amplified both the advance and the reversal. The broader risk is a widening gap between market prices and fundamentals wherever leverage and mechanical rebalancing become marginal price setters.
Credit tells a bifurcated story. As of July 17, U.S. investment-grade option-adjusted spreads were 79 basis points, broad high-yield spreads were 273 basis points, and CCC-and-lower spreads were 975 basis points. Loans trade wider than high yield bonds and some of that weakness is justified. Fitch reported that its market-concern leveraged-loan list had reached $273 billion, or 17.2% of the loan market. AI investment is increasingly debt-financed, both through public and private credit markets. According to estimates by the sell-side, the AI ecosystem is almost 20% of investment grade supply and 38% of issuance with maturities of 10 years or longer. BIS estimates that private-credit lending to AI-related firms exceeds $200 billion, almost 8% of outstanding private-credit loans, and identifies circular and off-balance-sheet structures as potential sources of opacity. The balanced conclusion is not that reported revenue is artificial or collateral is repeatedly pledged. It is that leverage, counterparty interdependence, and collateral values become more consequential if expected returns disappoint.
Q3 Scenario Analysis: Growth x Gulf Risk
In April we set out four scenarios. The timing of our domestic-rollover call was wrong: activity held up better than we expected, while the choke-point and re-escalation risks materialized episodically rather than as a steady state. For Q3, we separate the two independent axes that matter most – U.S. growth and Gulf escalation – and treat the Warsh communications reset as an overlay across all outcomes. The resulting two-by-two framework is:
Gulf de-escalation
Gulf re-escalation
U.S. resilience
Base case: September meeting is live for the Fed; high real yields; a modestly positive curve; narrow equity leadership; and tight top-quality credit.
Oil and near-term inflation compensation rise; the dollar strengthens; the curve bear-flattens; and energy and defense equities outperform.
U.S. rollover
Front-end rally and bull steepening; credit underperforms; and long Treasuries may provide less protection if the term premium remains elevated. Financial and utility equities outperform.
Stagflation-to-recession sequence: an initial bear flattening and risk-off move, followed by front-end easing and bull steepening if demand and credit deteriorate. Defensive equities outperform.
Across all four cells, reduced forward guidance increases sensitivity to data and events, raising realized volatility and the value of active price discovery.
The signposts that would move us between cells are:
Hormuz traffic, Gulf refinery runs, and onshore versus floating oil stocks;
Payroll breadth, participation, household employment, and real consumption;
Five-year real yields, five-year/five-year forward inflation compensation, and the 2s/10s curve;
CCC spreads, leveraged-loan prices, private-credit gates, and BDC marks; and
Hyperscaler earnings and capex guidance, free cash flow, and external financing needs.
Additional External Tails
Signaling around escalation in the Russia-Ukraine and U.S.-China rare-earth and technology tensions remain relevant overlays rather than core Q3 scenarios. We monitor them through observable signposts – changes in war strategies and negotiation tactics, export-licensing restrictions, heavy rare-earth prices, defense supply chains, and shipping or insurance costs – rather than treating them as stand-alone directional forecasts.
Conclusion
The central lesson for Q3 is not that one directional view dominates. It is that a resilient economy, a less prescriptive Federal Reserve, and renewed geopolitical tail risk can coexist. That combination raises realized volatility and makes patience, liquidity, and cross-market diversification more valuable.
As a result, our discretionary portfolios are tactically below their normal risk levels as binary events reduce the value of anticipatory conviction. When the market reaction turns on whether the Strait is open, negotiations resume, or a single data release changes the inferred reaction function, patience and liquidity are the most important risk-management tools. We are running smaller, keeping stops tight, and preserving risk budget for periods when the follow-up move arrives and fundamental analysis has more edge.
Our systematic portfolios remain broadly diversified and risk-targeted, seeking to capture persistent trends and cross-market dispersion without relying on the next headline. Position sizes adjust mechanically as volatility and correlation change, and risk is distributed across many markets. The different postures are intentional: discretionary strategies monetize anticipation and sequencing, while systematic strategies monetize persistence and breadth. The two approaches extract different features from the same regime and are designed to diversify one another.
Author Jens Foehrenbach President and CIO
Jens Foehrenbach, CFA, is the President and Chief Investment Officer of Graham Capital Management, L.P. (“Graham”). Mr. Foehrenbach oversees and supervises Graham’s discretionary and systematic portfolio manager teams, trading, and research and the firm’s data science, solutions and investor relations teams. Mr. Foehrenbach is also a member of the firm’s Executive, Investment, and Risk committees. Prior to joining Graham, he worked from 2008 to 2025 in several capacities at Man Group, including Head of Public Markets within Discretionary Investments, Chief Investment Officer of Man Solutions and Chief Investment Officer of Man FRM. Prior to joining Man Group, Mr. Foehrenbach worked at Harcourt Investment Consulting AG and before that at UBS AG, where he worked on the bank’s fixed income derivatives trading desk in Switzerland and London. Jens Foehrenbach received a Master’s degree in Business Economics from the University of Basel, Switzerland in 2001.
DISCOSURE
This presentation includes statements that may constitute forward-looking statements. These statements may be identified by words such as “expects,” “looks forward to,” “anticipates,” “intends,” “plans,” “believes,” “seeks,” “estimates,” “will,” “project” or words of similar meaning. In addition, our representatives may from time to time make oral forward-looking statements. Such statements are based on the current expectations and certain assumptions of Graham Capital Management’s (“Graham”) management, and are, therefore, subject to certain risks and uncertainties. A variety of factors, many of which are beyond Graham’s control, affect the operations, performance, business strategy and results of the accounts that it manages and could cause the actual results, performance, or achievements of such accounts to be materially different from any future results, performance or achievements that may be expressed or implied by such forward-looking statements or anticipated on the basis of historical trends.
This document is not a private offering memorandum and does not constitute an offer to sell, nor is it a solicitation of an offer to buy, any security. The views expressed herein are exclusively those of the authors and do not necessarily represent the views of Graham Capital Management. The information contained herein is not intended to provide accounting, legal, or tax advice and should not be relied on for investment decision making.
Tables, charts, and commentary contained in this document have been prepared on a best-efforts basis by Graham using sources it believes to be reliable although it does not guarantee the accuracy of the information on account of possible errors or omissions in the constituent data or calculations. No part of this document may be divulged to any other person, distributed, resold and/or reproduced without the prior written permission of Graham.
By clicking the Button you confirming that you’re agree with our following Terms and Conditions
Subscribe to our Resource Center
By clicking register you are confirming that you agree with our following Terms and Conditions
Welcome to Graham Capital Management
By entering this website you are agreeing to its Terms of Use.
The risk of loss in trading commodities can be substantial. You should therefore carefully consider whether such trading is suitable for you in light of your financial condition. The high degree of leverage that is often obtainable in commodity trading can work against you as well as for you. The use of leverage can lead to large losses as well as gains.
In some cases, managed commodity accounts are subject to substantial charges for management and advisory fees. It may be necessary for those accounts that are subject to these charges to make substantial trading profits to avoid depletion or exhaustion of their assets. The disclosure document contains a complete description of the principal risk factors and each fee to be charged to your account by the commodity trading advisor (“CTA”). The regulations of the commodity futures trading commission (“CFTC”) require that prospective clients of a CTA receive a disclosure document when they are solicited to enter into an agreement whereby the CTA will direct or guide the client’s commodity interest trading and that certain risk factors be highlighted. This brief statement cannot disclose all of the risks and other significant aspects of the commodity markets. Therefore, eligible investors should carefully study the disclosure document to determine whether such trading is appropriate for you in light of your financial condition. Eligible investors are encouraged to access the disclosure document by contacting Graham, which will be provided at no additional cost. The CFTC has not passed upon the merits of participating in this trading program nor on the adequacy or accuracy of the disclosure document. Other disclosure statements are required to be provided to you before a commodity account may be opened for you. By accepting the terms of this statement and entering the site you are confirming your understanding of this statement.
Any “benefit plan investor” (e.g. An IRA or other ERISA investor) investor is hereby deemed to represent to Graham Capital Management (“Graham”) that an independent fiduciary (as defined in the ERISA fiduciary rule) is exercising its independent judgment with regard to such investor’s investment in any Graham managed fund and is aware of and acknowledges and agrees that Graham and its affiliates are relying on the exception set forth in clause (c)(1) of the ERISA fiduciary rule (i.e., the “transactions with independent fiduciaries with financial expertise” exception) with respect to any communications made to the investor or the investor’s fiduciary that are considered recommendations concerning any transaction and such benefit plan investor.
Although the site may include investment-related information, nothing on the site is a recommendation that you purchase, sell or hold any security or other investment, or that you pursue any investment style or strategy.
We do not give any advice or make any representations through the site as to whether any investment is suitable to you or will be profitable.
Nothing on the site is intended to be, and you should not consider anything on the site to be, investment, accounting, tax or legal advice. If you would like investment, accounting, tax or legal advice, you should consult with your own financial advisors, accountants or attorneys regarding your individual circumstances and needs.
The past performance of any investment, investment strategy or investment style is not indicative of future performance.
If you have been provided with a password to access the site you are solely responsible for maintaining the confidentiality and security of your password. You may not disclose your password to any third party. You accept full responsibility for any use of your password. You must notify Graham immediately of any actual or suspected loss, theft or unauthorized use of your password.
We are not obligated to inquire as to the authority or propriety of any use of or action taken under your password. We will not be responsible for any loss to you that arises from such use or action or from your failure to comply with these provisions.
The site, including all content, is provided as is and as available.
We disclaim all representations and warranties, express or implied, of any kind with respect to the site and the content including warranties of merchantability, fitness for a particular purpose and non-infringement of intellectual property and proprietary rights.
Without limiting our general disclaimer, we do not warrant the availability, accuracy, completeness, timeliness, functionality, reliability, sequencing or speed of delivery of the site or the content.