Trend-following is among the most established and longest-standing investment strategies, with an estimated $350 billion1 in assets under management globally. Rooted in the premise that markets tend to exhibit persistent directional movements over time, trend-following seeks to capture these trends across a broad set of asset classes using disciplined, rules-based processes. By taking both long and short positions in liquid global markets, the strategy has historically demonstrated low correlation to traditional assets and the ability to perform across a range of market environments. As investors increasingly seek diversification and resilience in portfolios, trend-following has become a strategic allocation within many institutional investment frameworks. This primer outlines the key characteristics of trend-following and explores how the strategy can impact a broader investment portfolio when implemented as a long-term, strategic allocation.
Key Takeaways
- Trend-following has historically exhibited low correlation to traditional assets and can provide diversification across market environments.
- By taking both long and short positions, trend-following can perform during sustained market moves, including periods of market stress.
- Incorporating trend-following may improve portfolio outcomes by enhancing returns while reducing volatility, drawdowns, and equity sensitivity over time.
WHAT IS TREND-FOLLOWING?
Trend-following strategies use a systematic process, whereby algorithmic models seek to identify price trends in markets, with the expectation that upward trending markets may continue to rally and downward trending markets may continue to decline. These strategies take long positions in positively trending markets and short positions in negatively trending markets, using indicators based on price and volatility of the underlying assets to identify trends of various lengths. Trend followers seek to run diverse portfolios, typically trading liquid, centrally-cleared futures and currency markets, with the number of markets potentially ranging from tens to hundreds. These strategies often target consistent volatility within a predetermined range and try to preserve upside potential and limit downside risk by running with winners and cutting losing positions.
Theoretical Foundation: Why Do Markets Trend?
Trend-following performance depends on the existence of trends, or sustained directional moves in markets. Trends may exist both in times of market duress or during relatively stable market environments. A substantial body of academic research supports the existence of trends and offers several explanations for why they persist across asset classes:
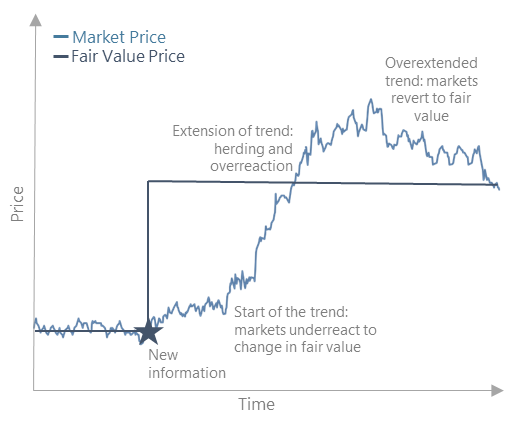
- Behavioral Bias and Herding Investors extrapolate recent price movements into the future and “follow the crowd,” reinforcing trends (Barberis, Shleifer, and Vishny, 1998; Bikhchandani, Hirshleifer, and Welch, 1992).
- Anchoring and Underreaction Investors adjust too slowly to new information, leading prices to trend as markets gradually incorporate news (Tversky and Kahneman, 1974; Hong and Stein, 1999).
- Disposition Effect Investors sell winners too early and hold onto losers (Frazzini, 2006).
- Risk Management Risk constraints can force investors to buy or sell assets as volatility or risk limits change, amplifying existing price moves (Danielsson, Shin, and Zigrand, 2012).
- Macroeconomic Regimes Shifts in monetary and fiscal policy can drive sustained trends across asset classes as markets reprice growth and inflation expectations (Ang and Bekaert, 2007).
- Time-Varying Risk Premia Changes in the compensation investors require to hold risky assets can lead to prolonged price movements across asset classes (Moskowitz, Ooi, and Pedersen, 2012).
Together, these behavioral and structural forces help explain why trends can emerge and persist, forming the foundation for trend-following strategies.
Illustrative Example: Why Trends Exist
TREND IDENTIFICATION
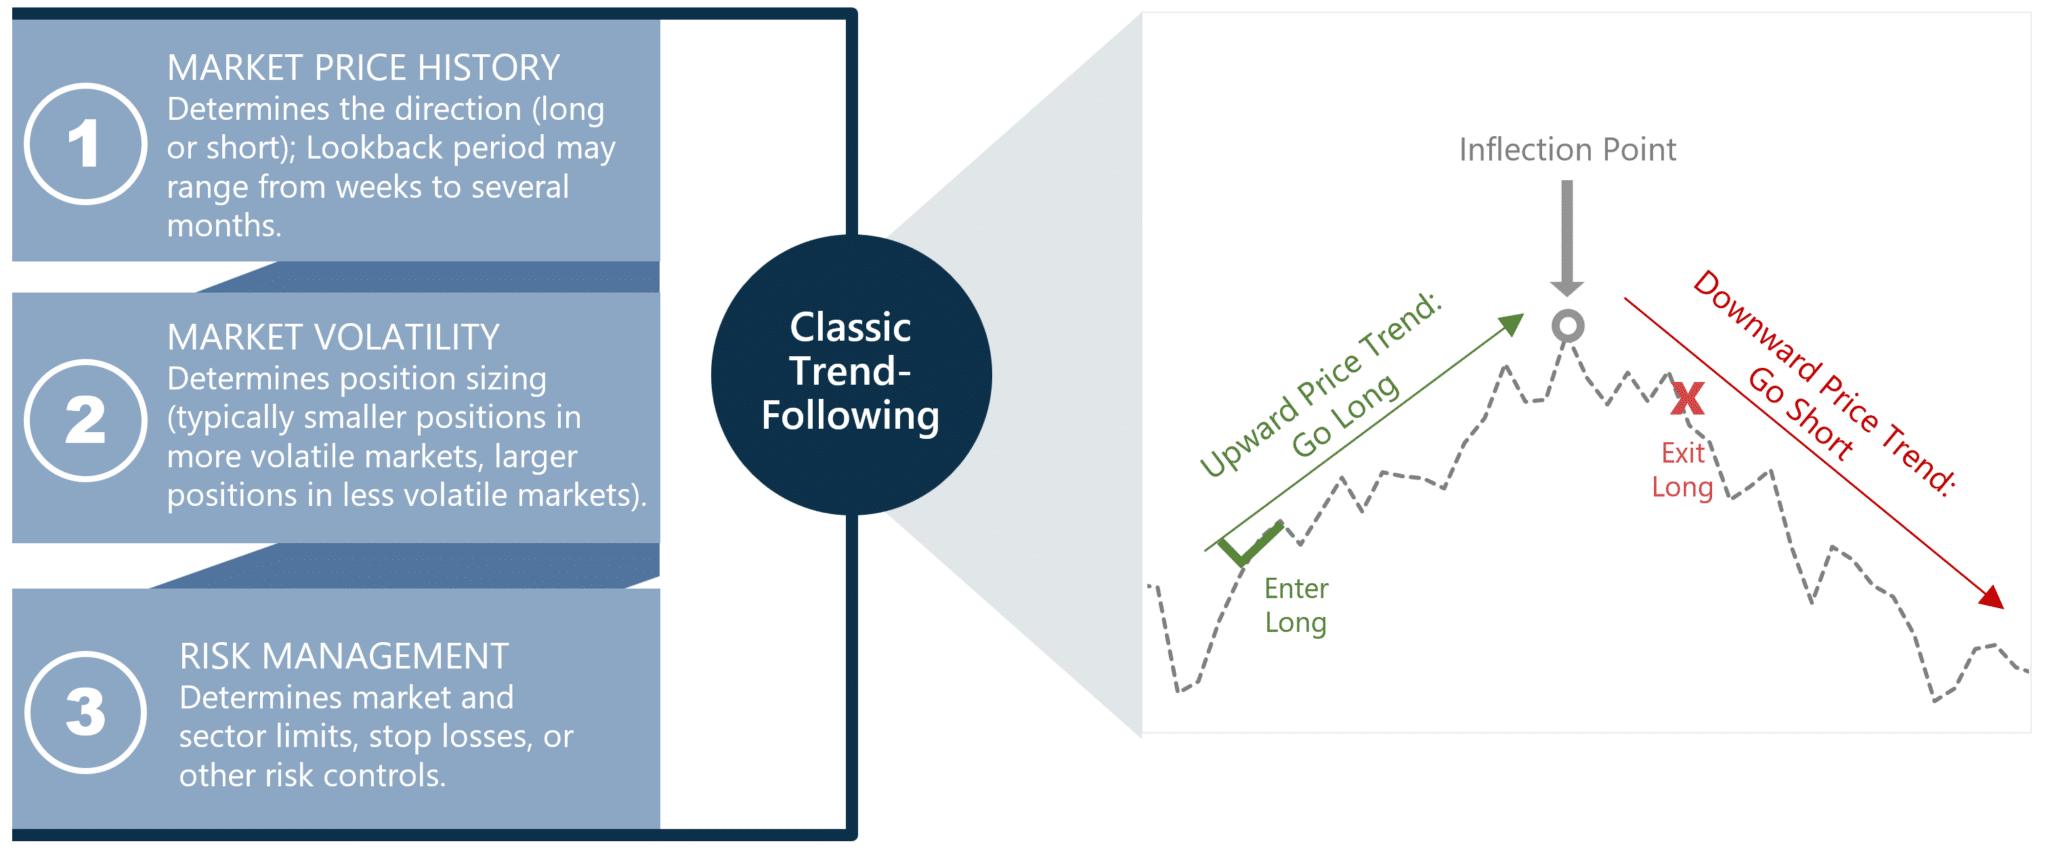
Trend-following strategies identify trends by systematically analyzing historical market prices. Algorithms evaluate price movements over lookback periods ranging from intraday to several months to determine whether a market is exhibiting sustained upward or downward momentum. When prices rise consistently, models may take long positions; when prices decline, they may take short positions.
Models also incorporate price volatility and other risk measures to determine position sizing and overall portfolio exposure. More volatile markets typically receive smaller allocations, while less volatile markets may receive larger/f positions to maintain balanced risk across a diversified set of assets such as equities, interest rates, currencies, and commodities.
Illustrative Example: How Trends are Identified
Signal Generation
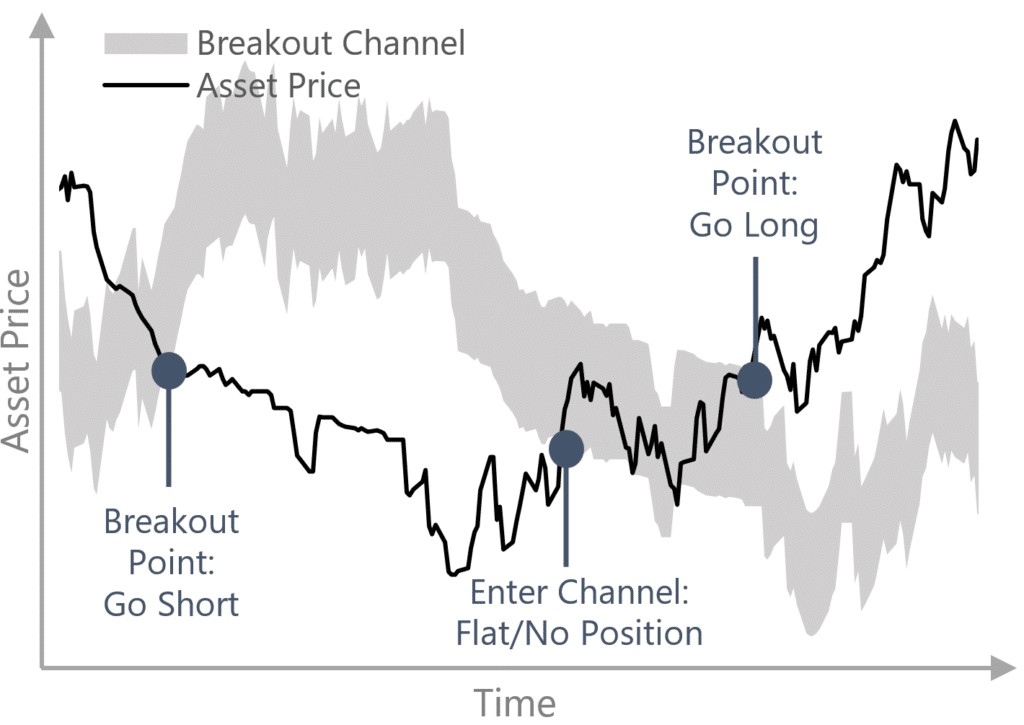
Moving average and breakout models are two prominent strategies used by most trend-followers for initial signal generation. While these models may be parameterized differently, the raw signals generated are often highly correlated over time because of their common dependence on past prices.
Breakout models compare the current price with a threshold to signal long, short, or no position. The threshold is determined by either a “price breakout” (past maximum or minimum price) or “channel breakout” (past price at a given lookback and trading range.)
Moving Average Models use moving averages of past prices to generate a trading signal. The difference between two moving averages, a “fast” and a “slow” one, determines a long or a short position. A crossover between the two will signal a trend reversal.
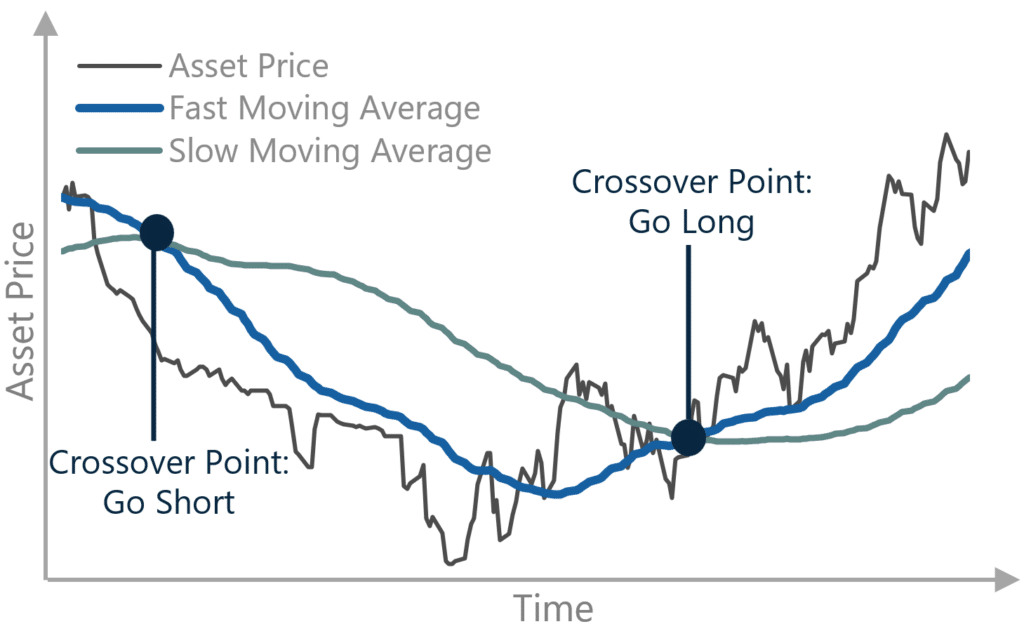
While these approaches differ in construction, they share a common objective: detecting persistent directional movement in prices. A key factor influencing how these models behave is the speed at which they respond to new information, which is largely determined by parameter choices such as lookback windows and signal thresholds.
THE SPEED OF TREND-FOLLOWING
A key dimension of trend-following strategies is speed, which refers to how quickly a model responds to emerging price movements. Speed is primarily determined by model parameters such as the length of moving averages and breakout lookback windows. Models that use shorter lookback periods are typically considered faster (short-term trend-following), as they respond more quickly to recent price changes and may identify new trends earlier. Slower models, which rely on longer lookback horizons (long-term trend-following), tend to react more gradually but may be less sensitive to short-term market noise. As a result, faster models can adapt more quickly to changing market conditions but may experience more frequent position changes and potential “whipsaws,” while slower models may capture longer, more persistent trends with fewer trades.
Signal Speed and Market Conditions
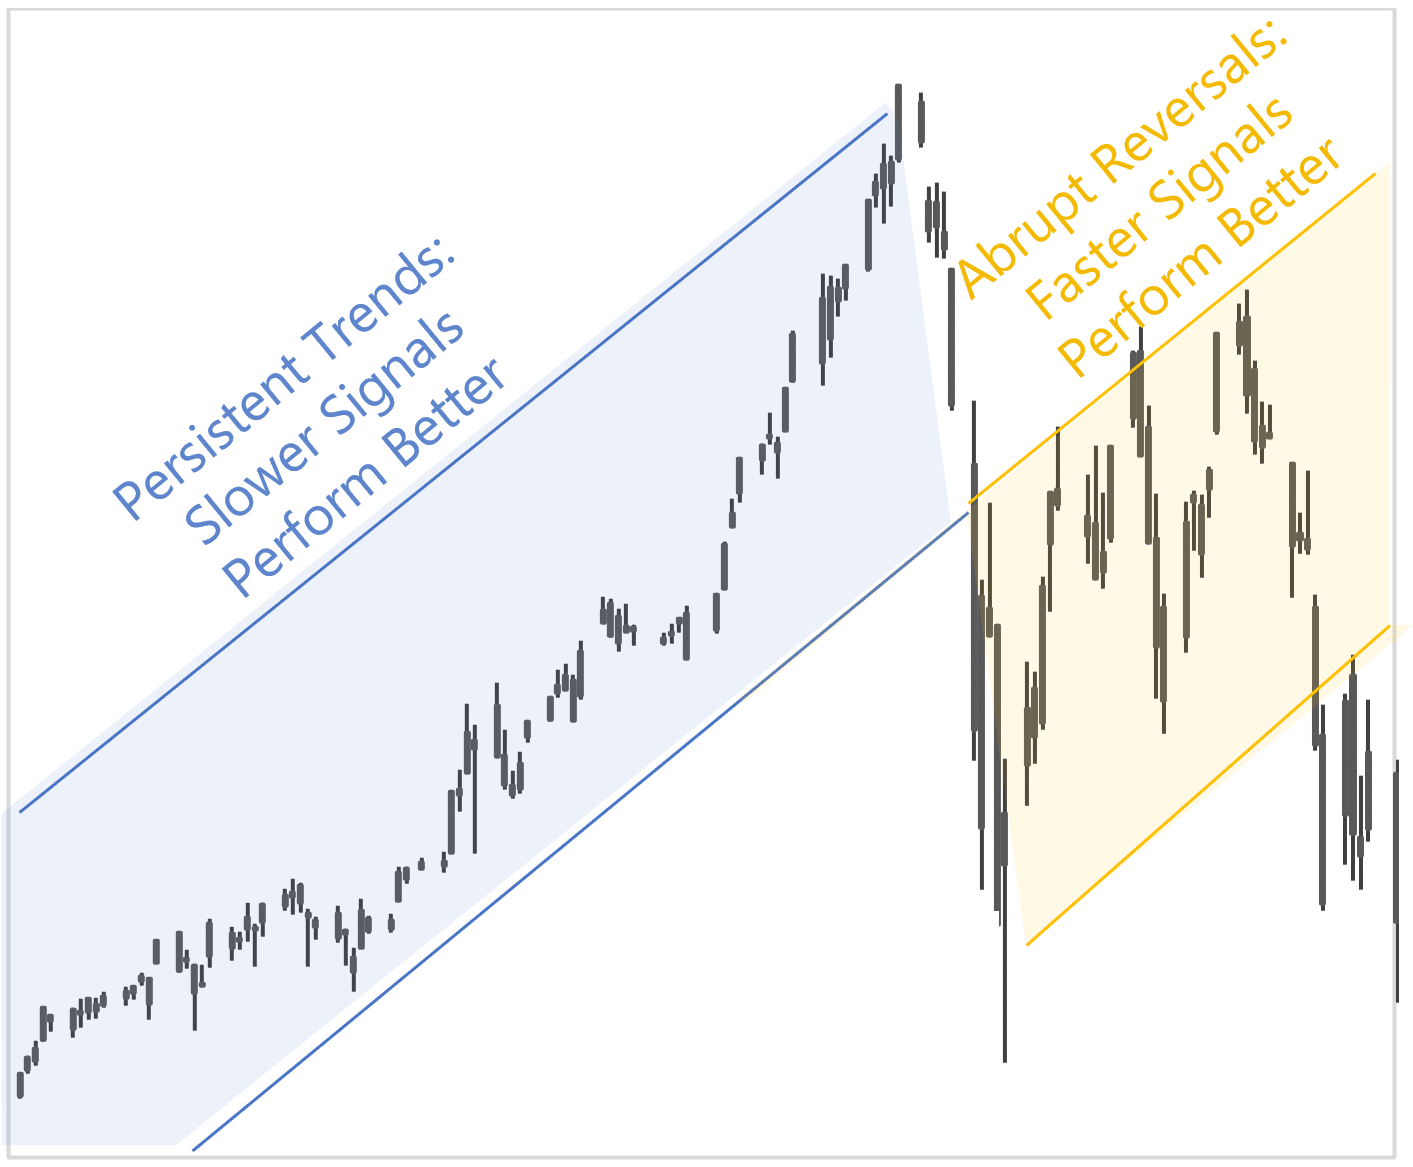
Evidence across time suggests that model speed can influence performance depending on market conditions. As shown in the heatmap below, which compares the performance of trend models across different time horizons, intermediate- to longer-term models have, on average, fared better than shorter-term models. When longer-term signals performed well, faster models often produced similar gains, though the reverse was less frequently the case.
However, faster models can be particularly valuable during periods of sudden market dislocation, when trends emerge quickly. For example, during episodes of sharp market stress such as the early stages of the COVID-19 crisis in 2020, faster signals were able to react more quickly. As a result, incorporating shorter-term models can help strategies respond more quickly during abrupt market events, complementing slower models that capture more persistent trends.
Return Heatmap: Model Time-Frames Performance2
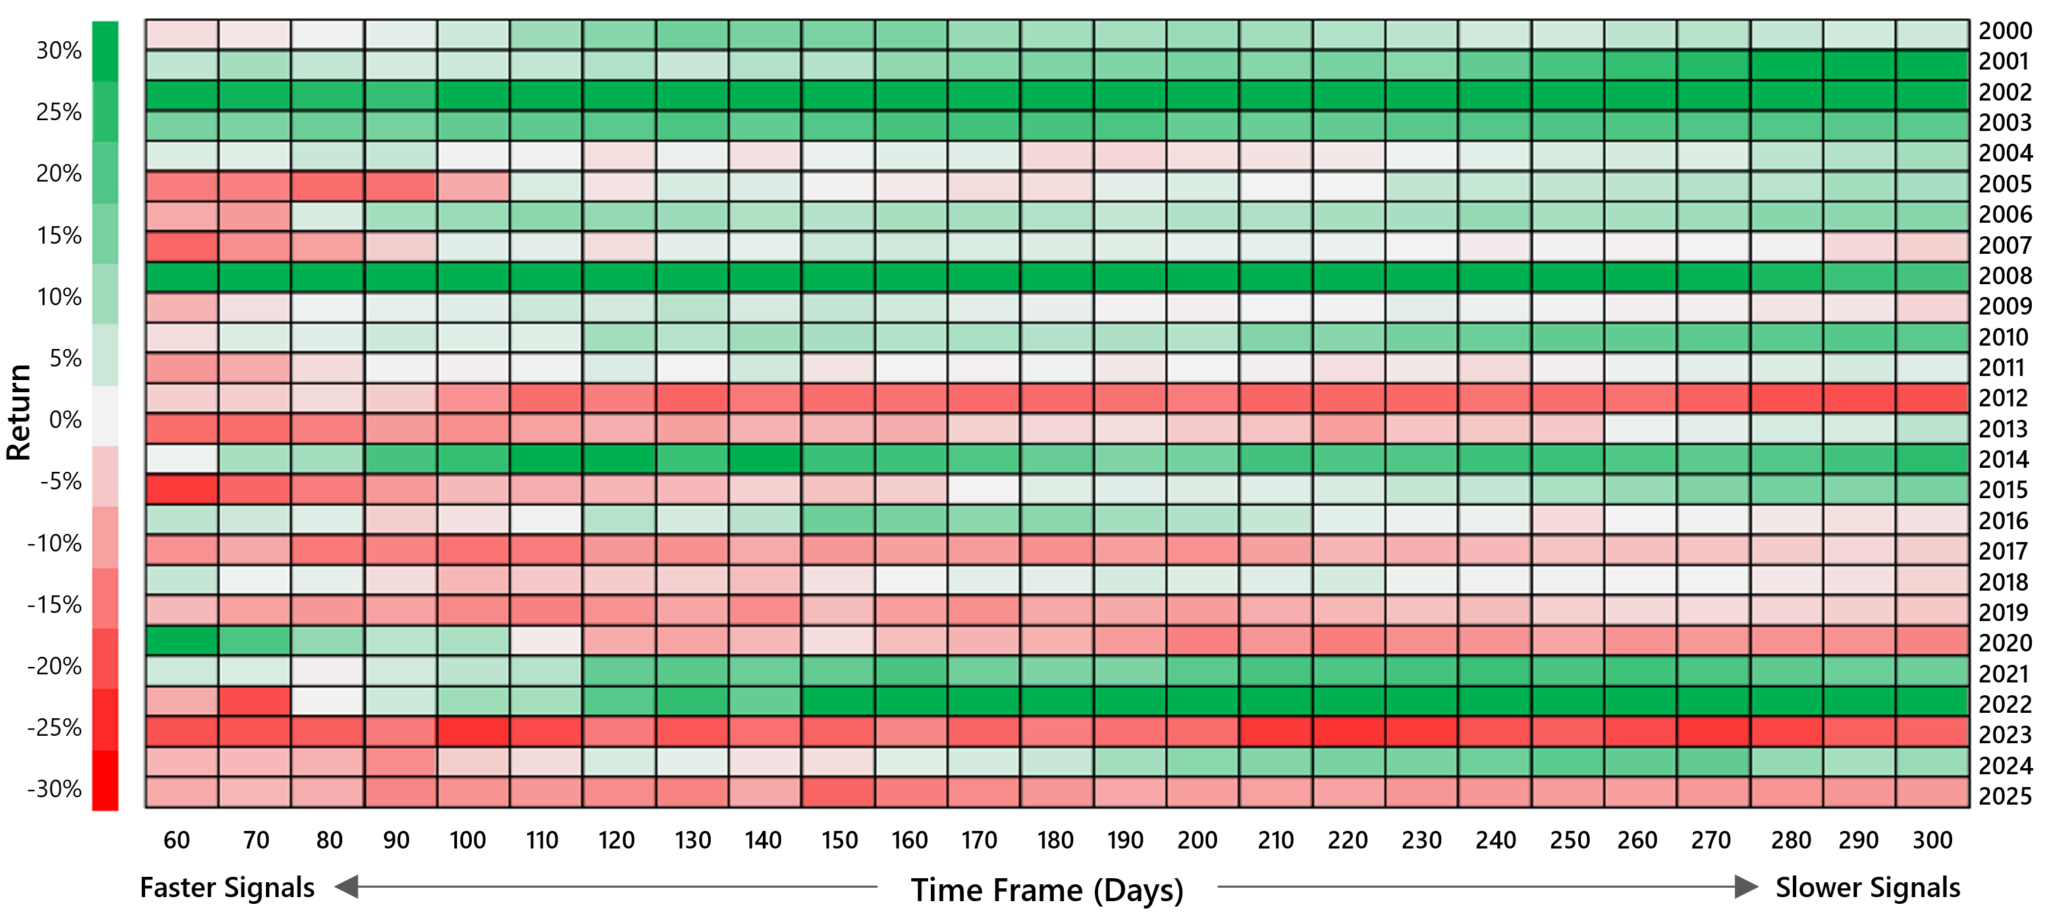
As a result, when selecting the speed of trend signals, many managers use a blend of signal speeds to balance responsiveness, cost efficiency, and robustness across different market environments.
MARKETS TRADED
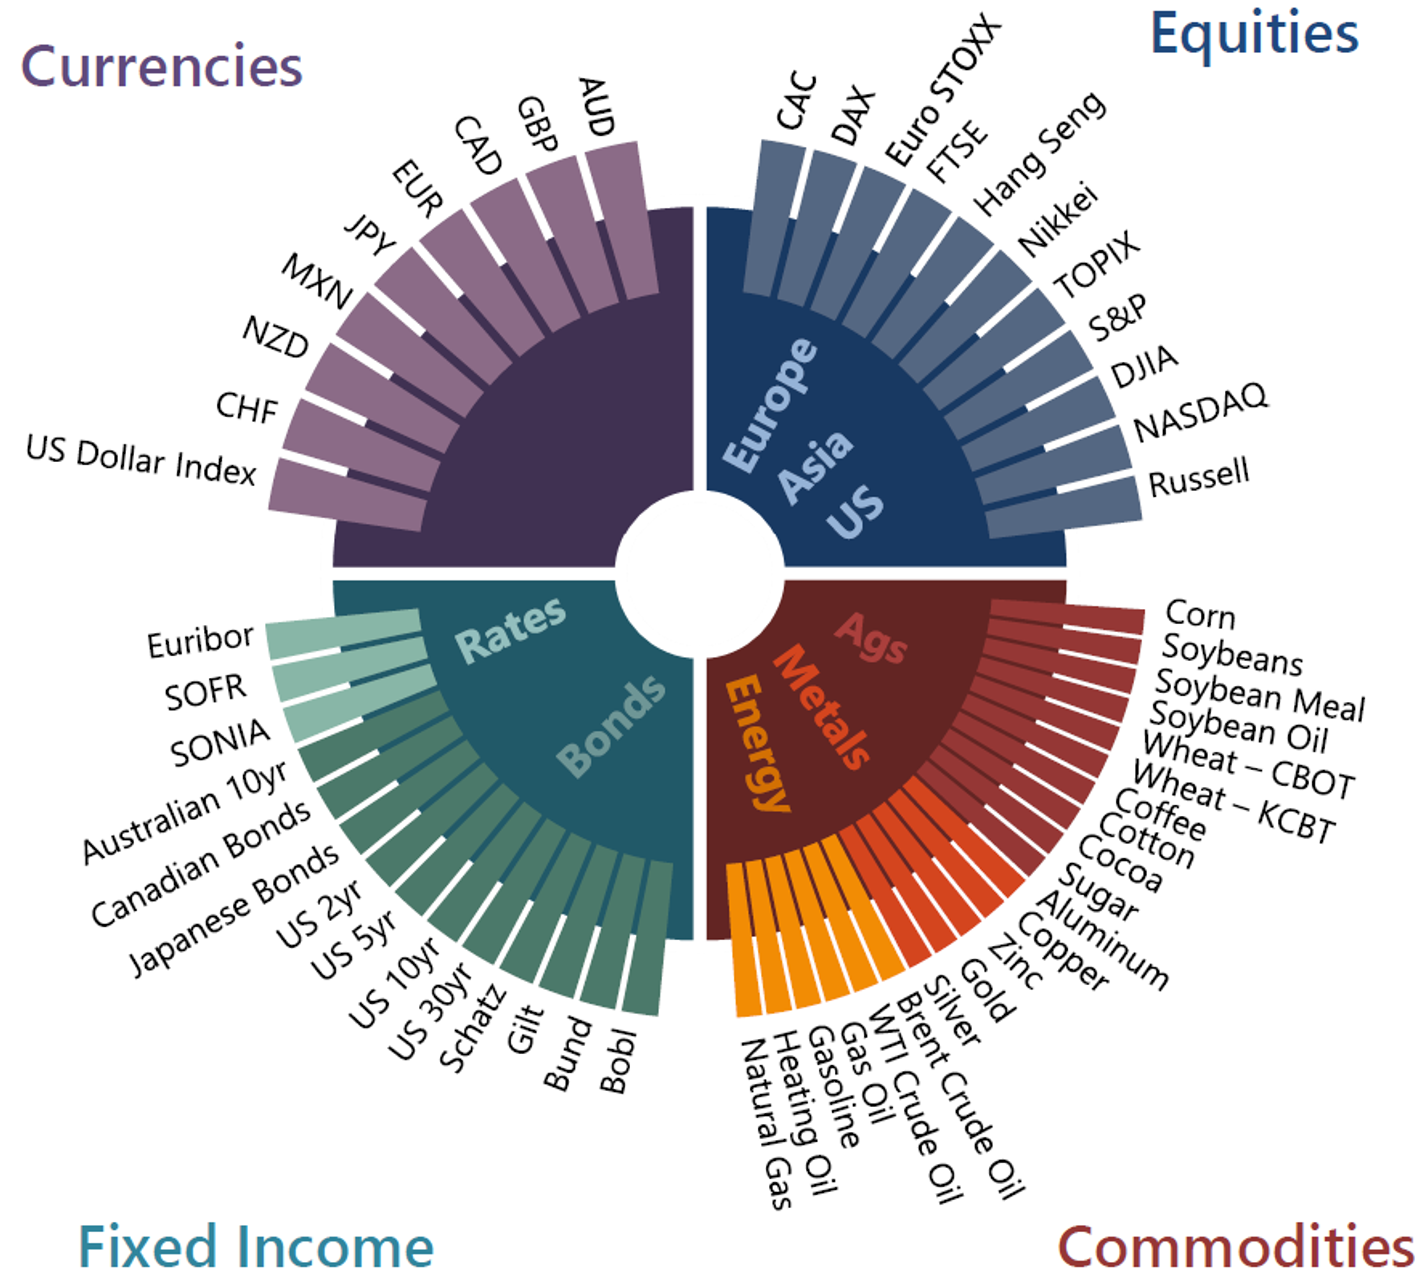
Trend-following typically trades a diversified set of liquid global markets, most commonly through exchange-traded futures and forwards. These instruments provide efficient access to major asset classes, including equities, fixed income, currencies, and commodities, and allow trend-followers to take both long and short positions. Because futures markets are liquid, centrally cleared, and relatively low cost to trade, portfolios often include dozens – or up to hundreds – of markets across global regions. Diversification across markets is a core feature of trend-following, as trends can emerge in different asset classes at different times.
Markets Commonly Traded by Trend-Followers
Considerations in Market Selection
Considerations for including markets in a trend-following portfolio include the potential alpha opportunity, correlation with existing holdings, liquidity, price history, transaction costs, and operational complexity. While some alternative or niche markets may exhibit strong trends, they can be more difficult to trade at scale due to lower liquidity, wider spreads or operational complexity. As a result, managers must weigh the incremental diversification and return potential against implementation challenges and costs. Legal and regulatory constraints also play an important role, as certain instruments or jurisdictions may impose restrictions on derivatives usage, margin requirements, reporting, or fund structures, particularly in vehicles such as UCITS or ‘40 Act funds. These considerations can influence which markets are included and how exposures are implemented within a given strategy.
PORTFOLIO CONSTRUCTION
Beyond choices related to signal generation, model speed, and the markets traded, portfolio construction plays a critical role in determining how signals are combined across the portfolio, how risk is allocated across markets, and how exposures are scaled while maintaining disciplined risk management.
Combining and Weighting Signals
Managers must determine how to combine and weight signals from multiple models and time horizons into a composite forecast that reflects the overall strength and direction of trends in each market. Considerations include historical signal quality, volatility and correlation to other signals, among other factors. Combining signals helps reduce reliance on any single model specification and can improve the consistency of trend detection.
Volatility Targeting and Leverage
Many trend-following strategies employ volatility targeting to maintain a relatively stable level of portfolio risk. Position sizes are scaled based on the volatility of each market, so more volatile assets receive smaller allocations and less volatile markets receive larger positions. Because futures markets require relatively little margin to gain exposure, leverage is often used to scale the overall portfolio to a target level of risk.
Volatility targeting can be implemented in different ways. Managers may differ in how volatility is measured and targeted across time horizons to balance responsiveness and stability, with the choice reflecting a preference for either stability or adaptability to changing market environments while maintaining overall portfolio risk within a desired range. Some managers use constant volatility targeting, adjusting exposures to maintain a fixed portfolio volatility level over both short and long time horizons. Others use dynamic volatility targeting, allowing the volatility to vary with market conditions or changes in risk estimates.
Risk Management
Managers typically apply risk controls such as position limits for individual markets, caps on sector or asset class exposure, and portfolio-level constraints. These measures help prevent excessive concentration in correlated markets and aim to ensure that portfolio risk remains diversified and controlled across changing market environments.
PERFORMANCE CHARACTERISTICS OF TREND-FOLLOWING
Trend-following has historically shown low correlation to traditional assets and the ability to perform in both rising and falling markets. Over time, it has delivered positive long-term returns with convex performance during sustained trends, including periods of market stress.
Please note: Equities and bonds are represented by the MSCI World Index and the Bloomberg Global Aggregate Index, respectively, unless otherwise noted. Please refer to the important disclosures at the end of this presentation.
Non-correlated returns
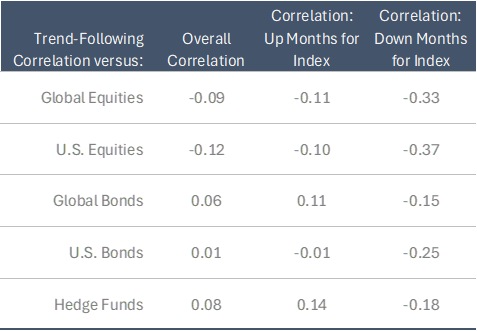
Over the long-term, trend-following has had low or even negative correlation to other investments. Trend following strategies also tend to exhibit negative downside correlation to equity markets, providing the potential to perform well during periods of sustained stress in global equity markets. At any point in time, however, correlations may be positive or negative, including during crisis conditions. Therefore, trend following strategies should not be treated exclusively as a portfolio hedge; rather, they may be viewed as additional sources of uncorrelated returns over intermediate to longer-term time periods.
Correlation of Trend-Following to Benchmarks
Since SG Trend Index Inception (Jan-00 to Dec-25)
No Structural Long or Short Bias
No structural long or short bias means that correlations may be positive or negative over different time horizons. On average, trend-following has no correlation to the markets that it trades and typically has positive correlation when markets move higher and negative correlation when markets decline.
Rolling Correlation to Equities and Equity Return
36 Month Rolling Correlation of SG Trend Index to Global Equities
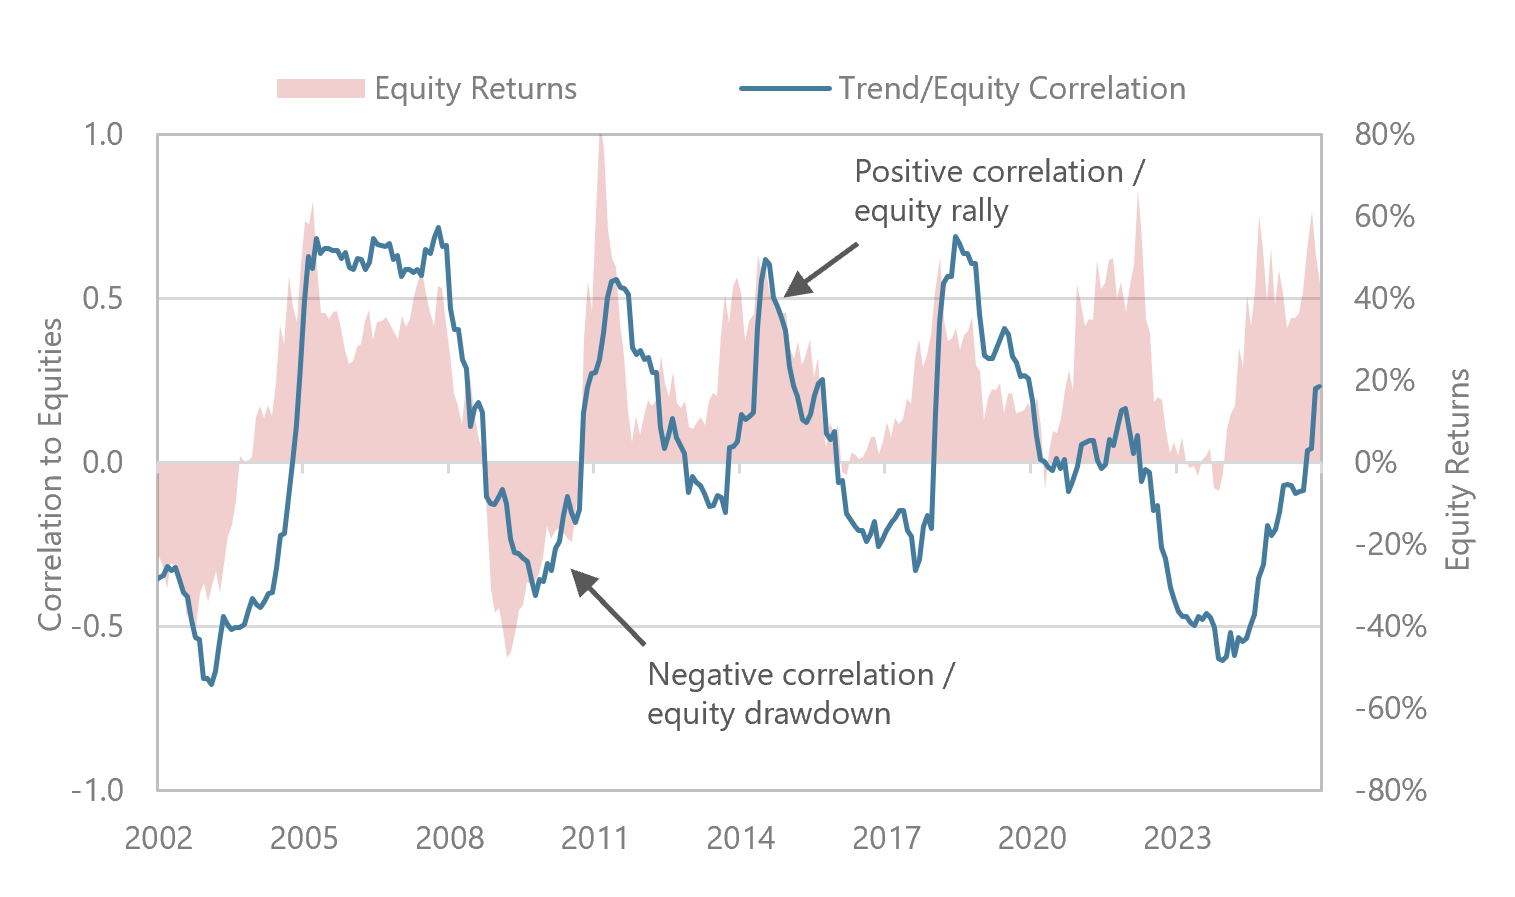
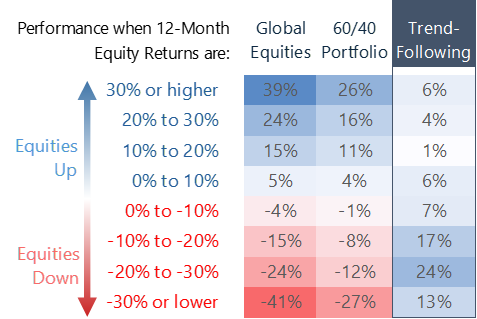
Because trend-following has no structural long or short bias, it can generate returns in both rising and falling markets and potentially perform well across different phases of the market cycle, as illustrated below.
Performance Across the Market Cycle
Since SG Trend Index Inception (Jan-00 to Dec-25)
Positive Convexity
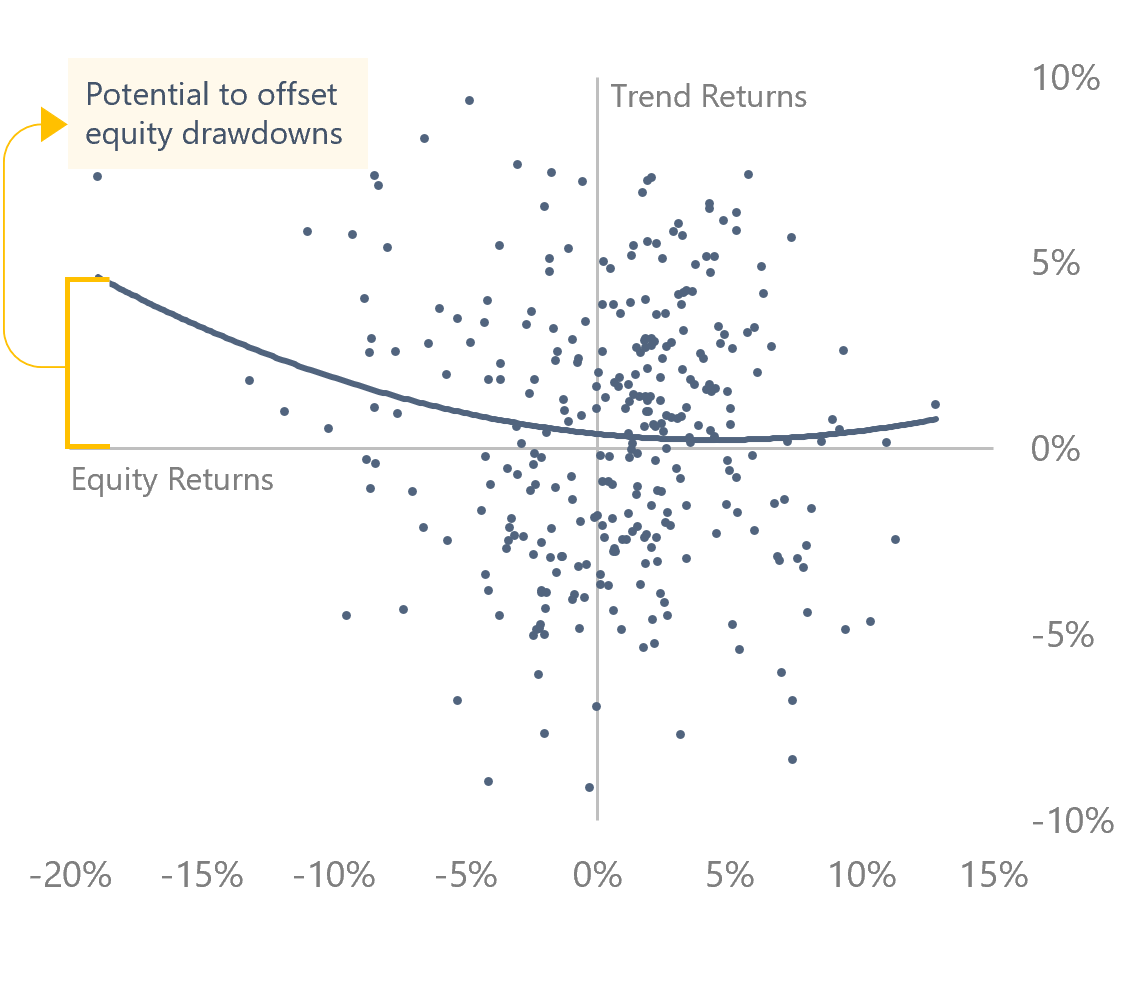
Trend-following exhibits positive convexity, or a non-linear pay-off to its underlying market universe. This is a highly valued characteristic for investors seeking portfolio diversification. As shown below, trend-following performs well during large directional moves (up or down), including equity stress periods. In these environments, the strategy can capture extended trends and generate outsized gains, while typically experiencing more limited losses during smaller or less persistent market moves.
Convexity of Trend-Following to Equities
Since SG Trend Index Inception (Monthly Returns, Jan-00 to Dec-25)
Key Performance Benefits
- Low correlation to traditional asset classes over time
- Ability to go long and short, with no inherent bias
- Ability to perform well across market cycles, including crisis periods
- Positive absolute returns over the long-term
- Buy and hold diversification benefits
Potential to Offset Equity Drawdowns
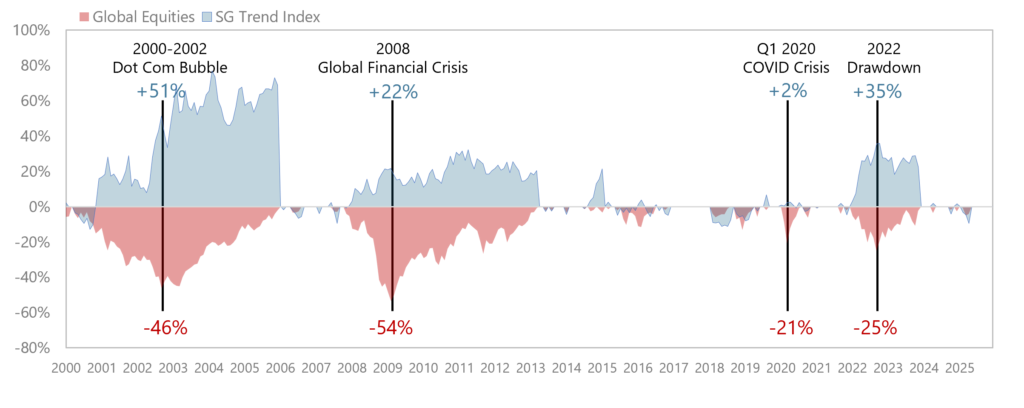
Trend-following has historically performed well, on average, during equity sell-offs, but positive performance during equity downturns is not guaranteed. For example, while trend-following was a good hedge during longer-term market declines such as the burst of the technology bubble and the Global Financial Crisis, it did not provide protection during the shorter-term equity sell-off in Q4 2018. Importantly, sharp reversals and short-term declines can be challenging for trend-following.
Trend-Following Performance during Underwater Drawdowns for Equities
Equity Peak-to-Recovery Drawdowns, Since SG Trend Index Inception (Jan-00 to Dec-25)
Market Inflection Points
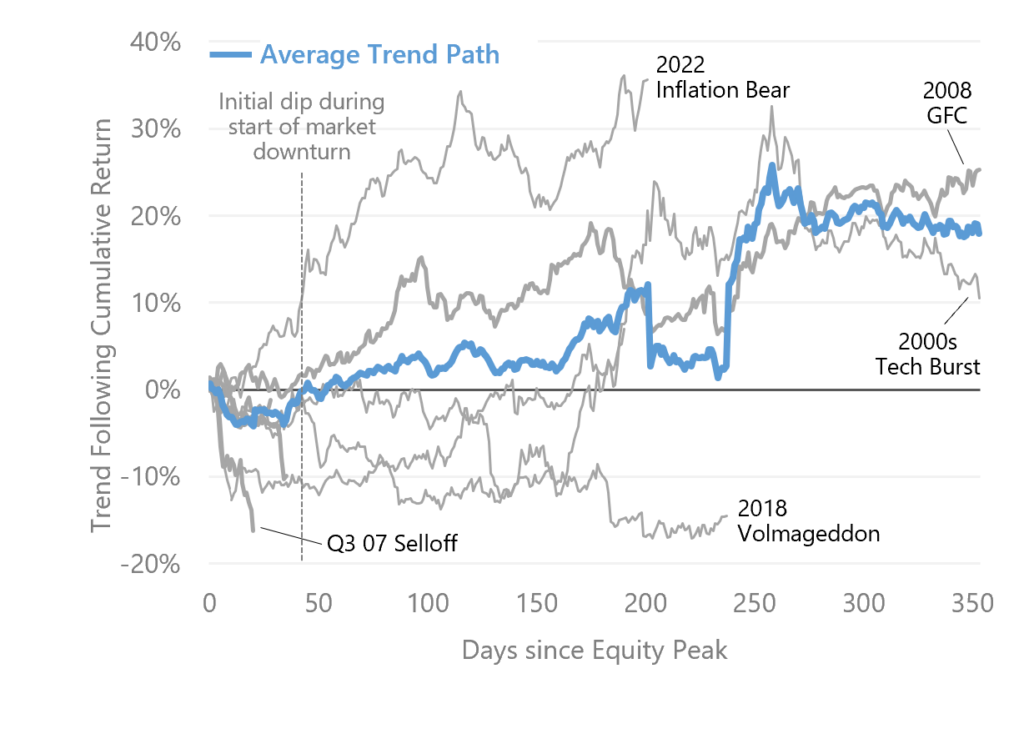
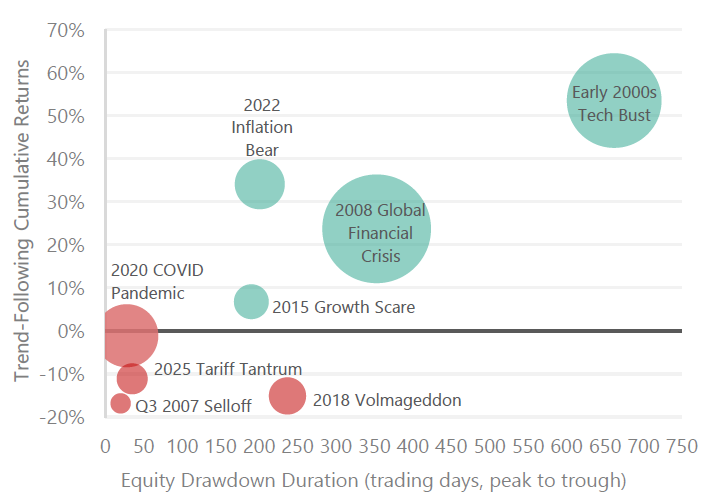
Trend-following can face challenges around market inflection points, when the direction of prices changes abruptly after an extended trend. Because models rely on past price behavior to confirm trends, they often enter after a move has begun and exit after a reversal is evident. As a result, strategies may experience losses during short, sharp market drawdowns, when prices rapidly shift direction, as positions are unwound before new trends are established. As illustrated in the figures below, performance tends to improve during more sustained equity drawdowns, while shorter, abrupt episodes can be more challenging, reflecting the design of trend systems to capture persistent moves rather than predict turning points.
Path of Trend Returns Across Largest Equity Drawdowns
Based on Daily Returns Jan-00 to Dec-25; Equity Drawdowns <-10%
Trend-Following Returns and Equity Drawdown Length
Based on Daily Returns Jan-00 to Dec-25; Equity Drawdowns <-10%
Trend-Following Across Volatility Regimes
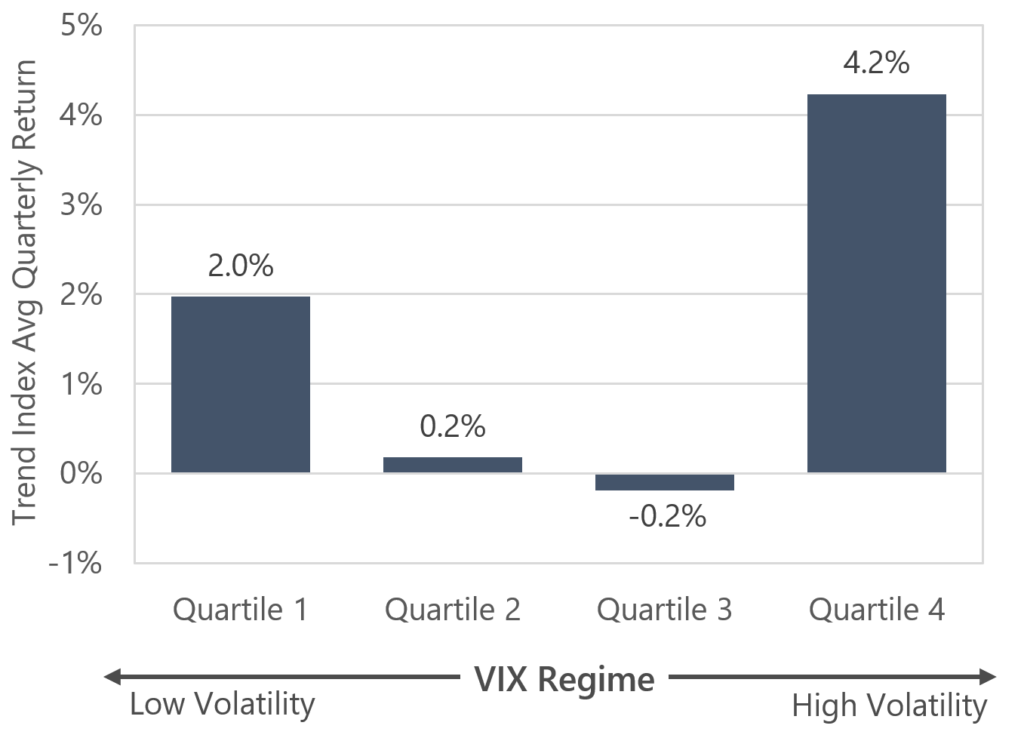
It is well-documented that trend-following generally performs well during crisis periods for equities. Since market volatility tends to spike during equity crisis periods, many investors are tempted to characterize trend-following as a long volatility strategy. Contrary to such an interpretation, trend-following can perform well in both high and low volatility environments. It is the existence of sustained market trends rather than high volatility that preconditions good trend-following performance. Using the VIX Index as a measure of market volatility, trend-following performance can be observed to perform well in both high and low volatility regimes, as shown below.
Trend-Following Returns Across Volatility Regimes
Since SG Trend Index Inception (Jan-00 to Dec-25)
Hypothetical Example of Low Volatility Asset
Consider a hypothetical asset that goes down 1% every day. Any reasonable implementation of trend-following would short this asset and thereby make a certain gain on an asset that itself has no volatility. Having zero volatility is not in itself a reason for poor trend-following performance.
Hypothetical Example of High Volatility Asset
Consider a hypothetical asset whose daily returns are consistently +5% followed by -5%. This asset is all volatility. Yet, trend-following on this asset would almost certainly yield terrible performance, suggesting that it is not volatility per se that matters to trend following.
Positive Skew
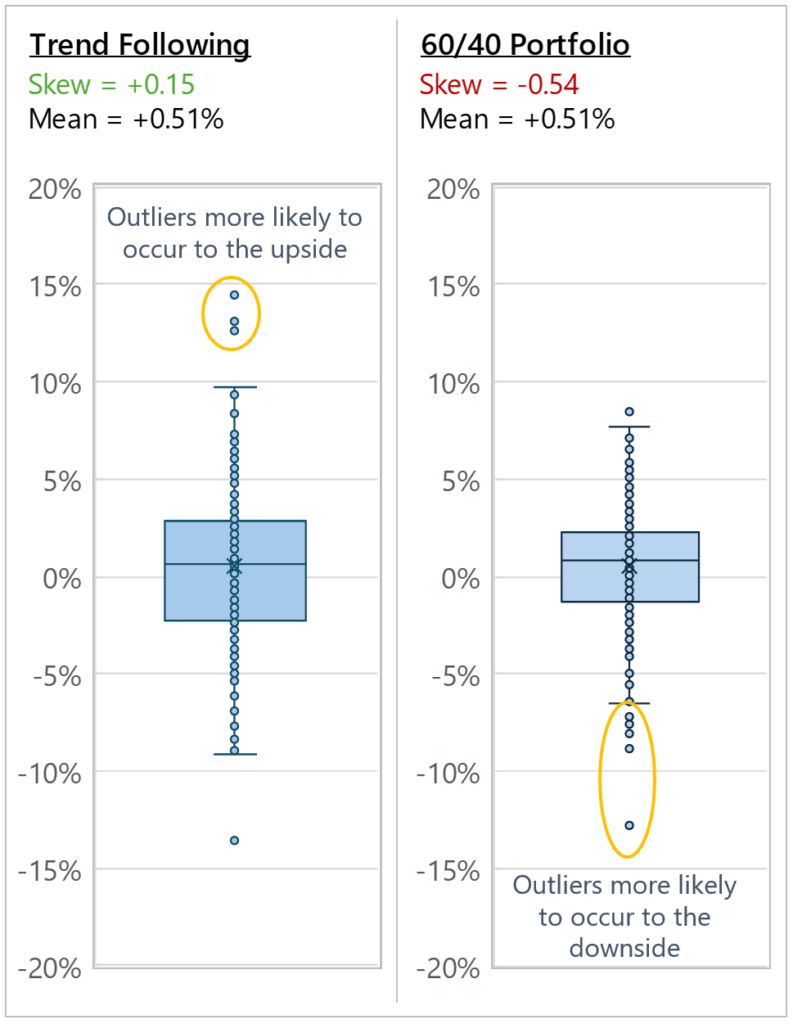
Trend-following strategies typically exhibit positive return skew (particularly when viewed using monthly or lower-frequency returns), meaning they tend to produce a larger number of modest losses and gains punctuated by occasional large positive returns when strong trends develop. These outsized gains often occur during periods of significant market dislocation or sustained directional moves across asset classes, when trend models can capture large price movements by holding positions in the direction of the trend.
This contrasts with traditional 60/40 equity–bond portfolios, which historically have exhibited negative skew. In such portfolios, returns are often characterized by frequent small gains during stable markets but occasional large losses during equity market drawdowns. Because trend-following tends to capture large moves during crises, its positive skew can provide a complementary return profile when combined with traditional assets.
Skew of Trend-Following and 60/40 Portfolio
Since SG Trend Index Inception (Monthly Returns, Jan-00 to Dec-25)
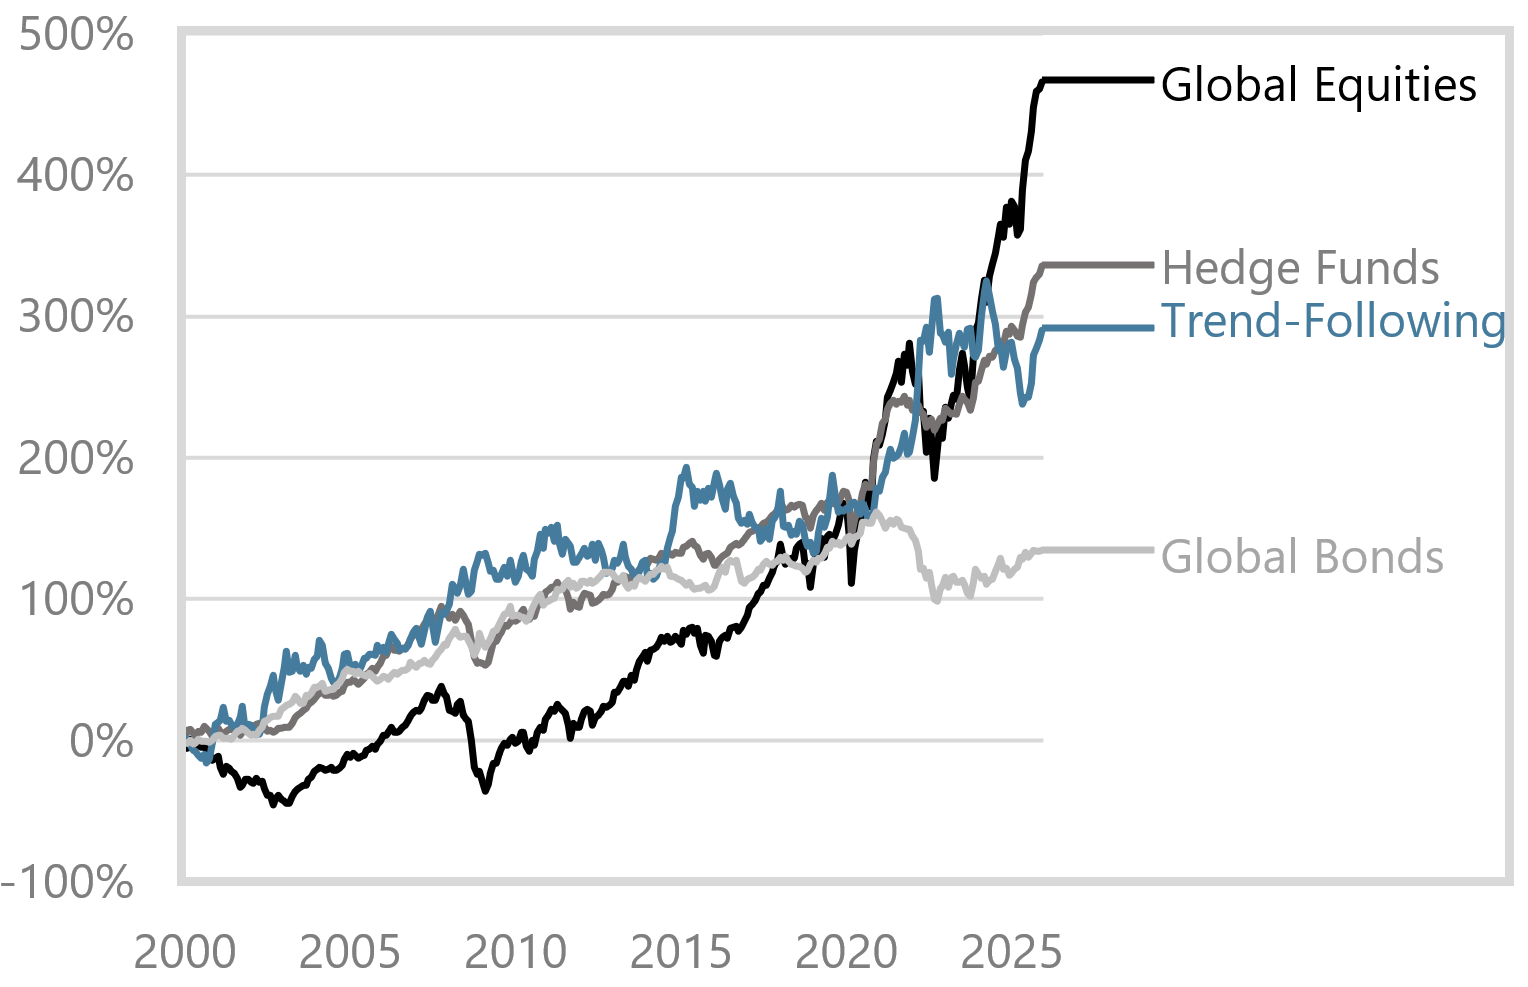
Long-Term Returns
Like all asset classes, trend-following has periods of strong, challenging, and flat performance. Over the long term, however, the strategy has maintained a strong return profile relative to other asset classes, even amid the “golden era” of significant appreciation of global equities and bonds post-2008, demonstrating its ability to deliver competitive returns across varying market environments.
Cumulative Return History
Since SG Trend Index Inception (Jan-00 to Dec-25)
IMPLEMENTATION CONSIDERATIONS
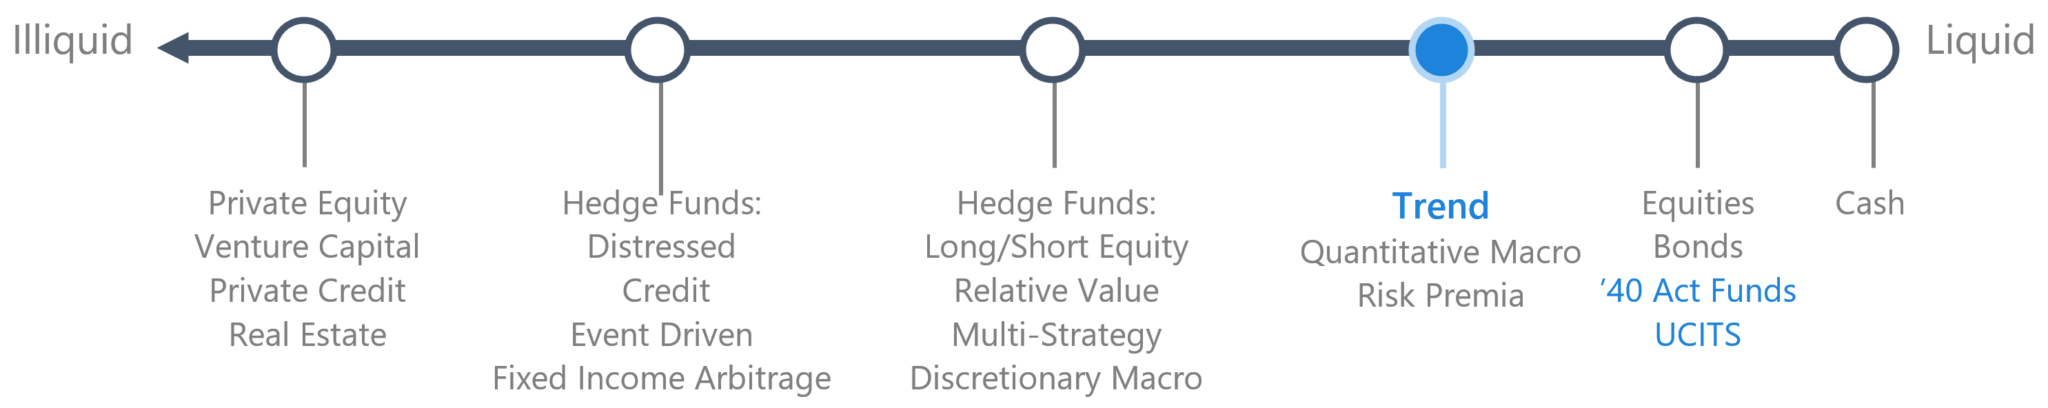
Because the market universe is liquid and the rules-based investment approach is scalable, many trend following funds available through liquid investment vehicles – including managed accounts, UCITS and ‘40Act (mutual fund) structures – with daily, weekly or monthly liquidity without lockups, gates or other constraints. These formats often translate to a high degree of transparency, including position-level reporting, and competitive fee structures.
Favorable Investment Structure
- Scalable, transparent, rules-based
- Liquid vehicle
- Typically lower-fee relative to other alternatives
- Available in a variety of formats, including managed accounts, UCITS, and ‘40 Act
Favorable Investment Structure
IMPLICATIONS FOR AN INVESTMENT PORFTOLIO
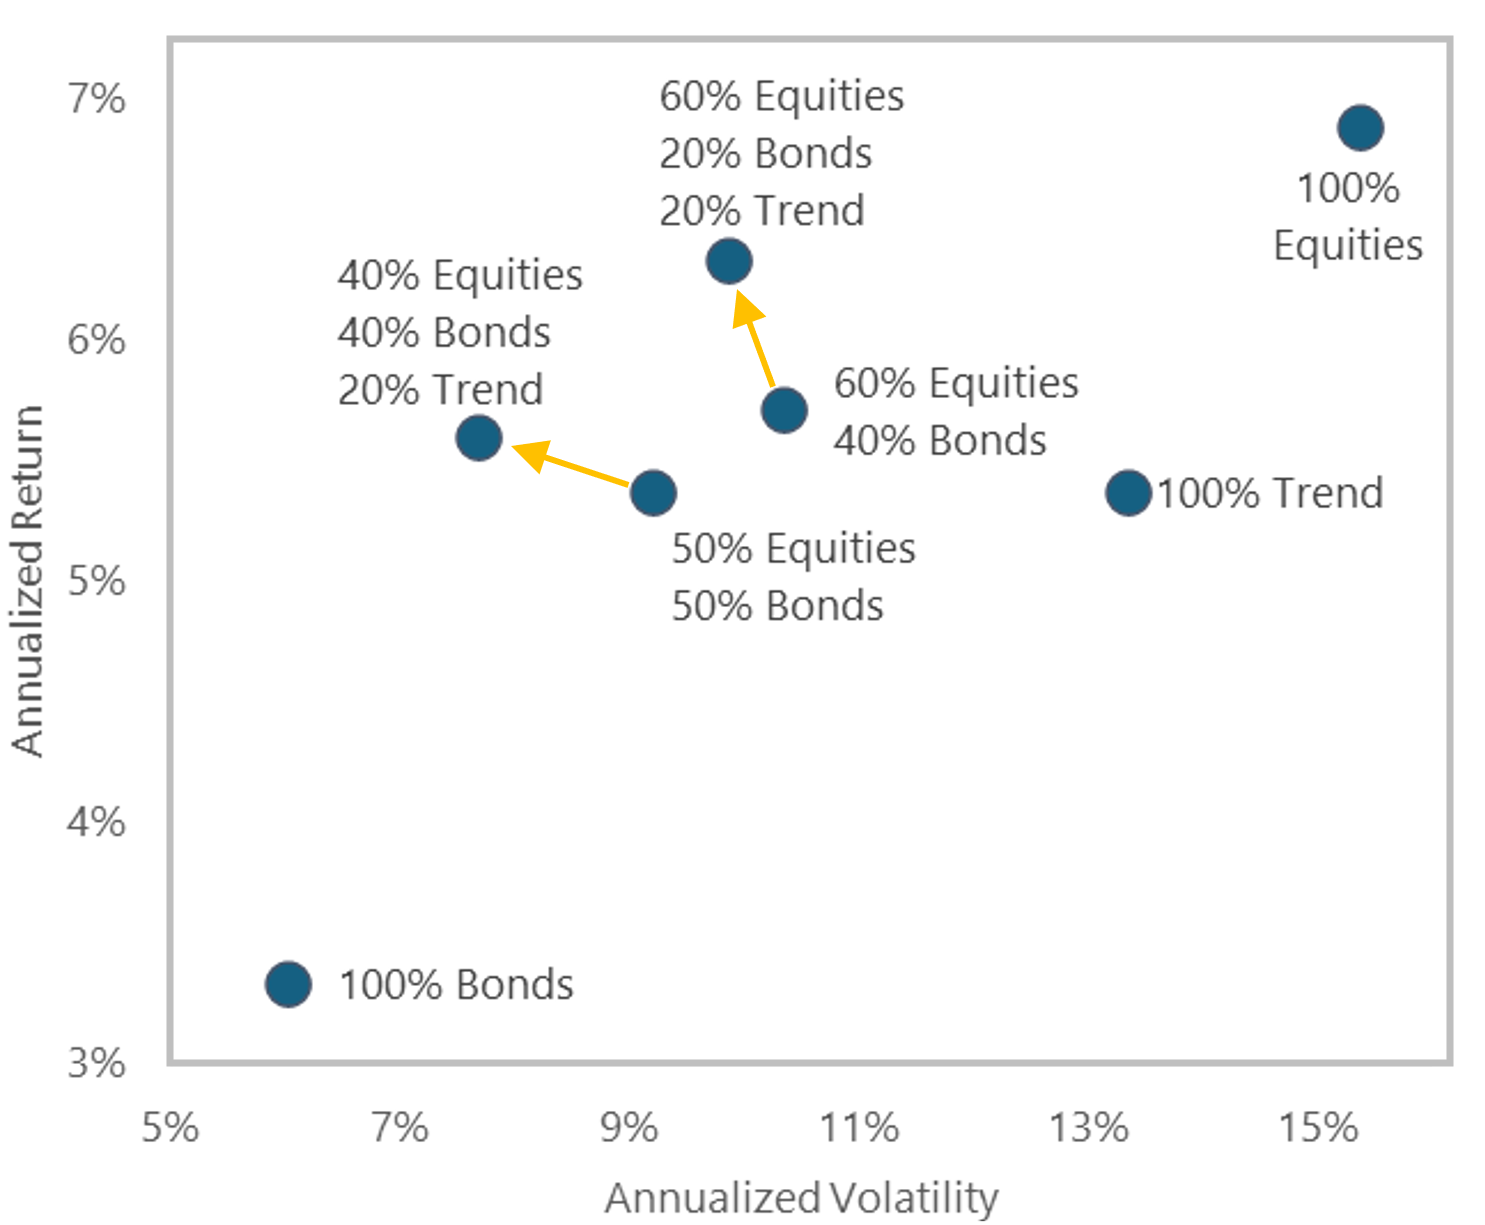
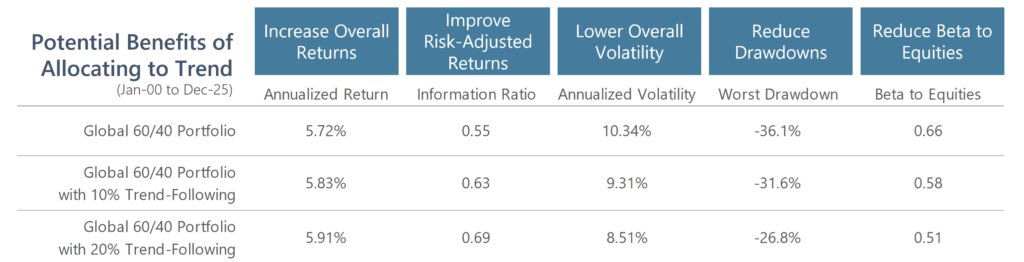
Traditional portfolios typically allocate to bonds to protect capital during equity downturns. However, the incorporation of asset classes beyond stocks and bonds can create many more opportunities for diversification in a portfolio. Over the long-term, allocating to trend following with a buy and hold approach over time has the potential to enhance returns while reducing volatility, drawdowns, and beta to equities.
Importantly, the value of trend-following lies not only in its return potential but in its diversifying role across market environments. By participating in both upward and downward trends across global asset classes, trend following can provide a complementary return stream that behaves differently from traditional assets, particularly during periods of sustained market stress or macroeconomic transition. As a result, incorporating trend-following within a broader portfolio may improve overall resilience, helping investors navigate a wider range of market conditions while maintaining a more balanced risk profile over time.
Impact on a Stock/Bond Portfolio
Since SG Trend Index Inception (Jan-00 to Dec-25)
IMPORTANT DISCLOSURE
REFERENCES
1 Total AUM in Trend-Following Strategies is sourced from BarclayHedge and represents estimated assets under management for the managed futures industry utilizing AUM information provided by contributing CTA managers as of September 30 2025.
2 Societe Generale Prime Services & Clearing (2025). Keeping Up With the Trend-Followers: CTA Industry Update. Societe Generale Corporate & Investment Banking.
Barberis, Nicholas, Andrei Shleifer, and Robert Vishny. A Model of Investor Sentiment. Journal of Financial Economics 49, no. 3 (1998): 307–343.
Tversky, Amos, and Daniel Kahneman. Judgment under Uncertainty: Heuristics and Biases. Science 185, no. 4157 (1974): 1124–1131.
Hong, Harrison, and Jeremy C. Stein. A Unified Theory of Underreaction, Momentum Trading, and Overreaction in Asset Markets. Journal of Finance 54, no. 6 (1999): 2143–2184.
Frazzini, Andrea. The Disposition Effect and Underreaction to News. Journal of Finance 61, no. 4 (2006): 2017–2046.
Bikhchandani, Sushil, David Hirshleifer, and Ivo Welch. A Theory of Fads, Fashion, Custom, and Cultural Change as Informational Cascades. Journal of Political Economy 100, no. 5 (1992): 992–1026.
Danielsson, Jon, Hyun Song Shin, and Jean-Pierre Zigrand. Endogenous Risk. In Handbook of the Economics of Finance, Vol. 2, edited by George M. Constantinides, Milton Harris, and René M. Stulz, 292–317. Amsterdam: Elsevier, 2012.
Ang, Andrew, and Geert Bekaert. Stock Return Predictability: Is It There? Review of Financial Studies 20, no. 3 (2007): 651–707.
Moskowitz, Tobias J., Yao Hua Ooi, and Lasse Heje Pedersen. Time Series Momentum. Journal of Financial Economics 104, no. 2 (2012): 228–250.
LEGAL DISCLAIMER
Source of data: Graham Capital Management (“Graham”), unless otherwise stated
This document is neither an offer to sell nor a solicitation of any offer to buy shares in any fund managed by Graham and should not be relied on in making any investment decision. Any offering is made only pursuant to the relevant prospectus, together with the current financial statements of the relevant fund and the relevant subscription documents all of which must be read in their entirety. No offer to purchase shares will be made or accepted prior to receipt by the offeree of these documents and the completion of all appropriate documentation. The shares have not and will not be registered for sale, and there will be no public offering of the shares. No offer to sell (or solicitation of an offer to buy) will be made in any jurisdiction in which such offer or solicitation would be unlawful. No representation is given that any statements made in this document are correct or that objectives will be achieved. This document may contain opinions of Graham and such opinions are subject to change without notice. Information provided about positions, if any, and attributable performance is intended to provide a balanced commentary, with examples of both profitable and loss-making positions, however this cannot be guaranteed.
It should not be assumed that investments that are described herein will be profitable. Nothing described herein is intended to imply that an investment in the fund is safe, conservative, risk free or risk averse. An investment in funds managed by Graham entails substantial risks and a prospective investor should carefully consider the summary of risk factors included in the Private Offering Memorandum entitled “Risk Factors” in determining whether an investment in the Fund is suitable. This investment does not consider the specific investment objective, financial situation or particular needs of any investor and an investment in the funds managed by Graham is not suitable for all investors. Prospective investors should not rely upon this document for tax, accounting or legal advice. Prospective investors should consult their own tax, legal accounting or other advisors about the issues discussed herein. Investors are also reminded that past performance should not be seen as an indication of future performance and that they might not get back the amount that they originally invested. The price of shares of the funds managed by Graham can go down as well as up and be affected by changes in rates of exchange. No recommendation is made positive or otherwise regarding individual securities mentioned herein.
This presentation includes statements that may constitute forward-looking statements. These statements may be identified by words such as “expects,” “looks forward to,” “anticipates,” “intends,” “plans,” “believes,” “seeks,” “estimates,” “will,” “project” or words of similar meaning. In addition, our representatives may from time to time make oral forward-looking statements. Such statements are based on the current expectations and certain assumptions of Graham’s management, and are, therefore, subject to certain risks and uncertainties. A variety of factors, many of which are beyond Graham’s control, affect the operations, performance, business strategy and results of the accounts that it manages and could cause the actual results, performance or achievements of such accounts to be materially different from any future results, performance or achievements that may be expressed or implied by such forward-looking statements or anticipated on the basis of historical trends.
Tables, charts and commentary contained in this document have been prepared on a best efforts basis by Graham using sources it believes to be reliable although it does not guarantee the accuracy of the information on account of possible errors or omissions in the constituent data or calculations. No part of this document may be divulged to any other person, distributed, resold and/or reproduced without the prior written permission of Graham.
INDEX DISCLOSURE
The below are widely used indices that have been selected for comparison purposes only. Indices are unmanaged, and one cannot invest directly in an index. Except for HFR indices, which do reflect fees and expenses, the indices do not reflect any fees, expenses or sales charges. Unlike most asset class indices, hedge fund indices included in this presentation have limitations, which should be considered in connection with their use in this presentation. These limitations include survivorship bias (the returns of the indices may not be representative of all the hedge funds in the universe because of the tendency of lower performing funds to leave the index); heterogeneity (not all hedge funds are alike or comparable to one another, and the index may not accurately reflect the performance of a described style); and limited data (many hedge funds do not report to indices, and the index may omit funds which could significantly affect the performance shown; these indices are based on information self-reported by hedge fund managers which may decide at any time whether or not they want to continue to provide information to the index). These indices may not be complete or accurate representations of the hedge fund universe and may be affected by the biases described above.
BLOOMBERG GLOBAL AGGREGATE INDEX (“GLOBAL BONDS”): The Bloomberg Global Aggregate Index is a broad-based market capitalization weighted measure of the global investment grade fixed-rate debt markets. This multi-currency benchmark includes treasury, government-related, corporate and securitized fixed-rate bonds from both developed and emerging markets issuers. There are four regional aggregate benchmarks that largely comprise the Global Aggregate Index: The US Aggregate, the Pan-European Aggregate, the Asian-Pacific Aggregate and the Canadian Aggregate Indices. The Global Aggregate Index also includes Eurodollar, Euro-Yen, and 144A Index-eligible securities, and debt from five local currency markets not tracked by the regional aggregate benchmarks (CLP, MXN, ZAR, ILS and TRY).
BLOOMBERG US AGGREGATE BOND INDEX (“U.S. BONDS”): The Bloomberg US Aggregate Bond Index is a broad-based flagship benchmark that measures the investment grade, US dollar denominated, fixed-rate taxable bond market. The index includes Treasuries, government-related and corporate securities, fixed rate agency MBS, ABS and CMBS (agency and non-agency).
HFRI FUND WEIGHTED COMPOSITE INDEX (“HEDGE FUNDS”): The HFRI Fund Weighted Composite Index is an equal-weighted index that includes over 2000 constituent funds which have at least $50M under management or have been actively traded for at least 12 months. The e are no fund of funds included in this index. All funds are reported in USD and returns are reported net of all fees on a monthly basis. Individuals cannot invest directly into this index.
MSCI WORLD INDEX (“GLOBAL EQUITIES”): A market cap weighted stock market index of 1,652 global stocks and is used as a common benchmark for ‘world’ or ‘global’ stock funds. The index includes a collection of stocks of all the developed markets in the world, as defined by MSCI. The index includes securities from 23 countries but excludes stocks from emerging and frontier economies.
S&P 500 TOTAL RETURN INDEX (“U.S. EQUITIES”): An unmanaged, market value-weighted index measuring the performance of 500 U.S. stocks chosen for market size, liquidity, and industry group representation. Includes the reinvestment of dividends. The S&P 500 index components and their weightings are determined by S&P Dow Jones Indices.
60/40 PORTFOLIO or GLOBAL 60/40 PORTFOLIO: Reflects a hypothetical portfolio with a 60% allocation to equities and a 40% allocation to bonds as represented by the MSCI World Index and the Bloomberg Global Aggregate Index, rebalanced monthly. Performance of the underlying stock and bond indices is calculated on a gross basis and includes the reinvestment of dividends. This is a hypothetical composite portfolio that is not investable. Please refer to important disclosures at the end of this document regarding hypothetical performance.
HYPOTHETICAL PERFORMANCE RESULTS HAVE MANY INHERENT LIMITATIONS. NO REPRESENTATION IS BEING MADE THAT ANY ACCOUNT WILL OR IS LIKELY TO ACHIEVE PROFITS OR LOSSES SIMILAR TO THOSE SHOWN. IN FACT, THERE ARE FREQUENTLY SHARP DIFFERENCES BETWEEN HYPOTHETICAL PERFORMANCE RESULTS AND THE ACTUAL RESULTS SUBSEQUENTLY ACHIEVED BY ANY PARTICULAR TRADING PROGRAM. ONE OF THE LIMITATIONS OF HYPOTHETICAL PERFORMANCE RESULTS IS THAT THEY ARE GENERALLY PREPARED WITH THE BENEFIT OF HINDSIGHT. IN ADDITION, HYPOTHETICAL TRADING DOES NOT INVOLVE FINANCIAL RISK, AND NO HYPOTHETICAL TRADING RECORD CAN COMPLETELY ACCOUNT FOR THE IMPACT OF FINANCIAL RISK IN ACTUAL TRADING. FOR EXAMPLE, THE ABILITY TO WITHSTAND LOSSES OR TO ADHERE TO A PARTICULAR TRADING PROGRAM IN SPITE OF TRADING LOSSES ARE MATERIAL POINTS WHICH CAN ALSO ADVERSELY AFFECT TRADING RESULTS. THERE ARE NUMEROUS OTHER FACTORS RELATED TO THE MARKETS IN GENERAL OR TO THE IMPLEMENTATION OF ANY SPECIFIC TRADING PROGRAM WHICH CANNOT BE FULLY ACCOUNTED FOR IN THE PREPARATION OF HYPOTHETICAL PERFORMANCE RESULTS AND ALL OF WHICH CAN ADVERSELY AFFECT ACTUAL TRADING RESULTS.
Equities and bonds are represented by the MSCI World Index and the Bloomberg Global Aggregate Index, respectively, unless otherwise noted.
