ABSTRACT
Trend-following strategies seek to profit from sustained directional price moves (trends) in markets. In this analysis, we present the Trend Ratio and the Directional Indicator as means of quantifying the “trendiness” of markets at the individual level and in the aggregate. We observe the trendiness of recent and historical market environments and the impact on trend-following strategies. Market environments with a significant number of trends across a given investment universe often present the best opportunity for trend-following strategies. These opportunities may exist both in times of market duress such as the 2008 financial crisis and during relatively complacent market environments such as 2014.
1. INTRODUCTION
Trend-following tends to perform well when there are trends to follow, in other words, when markets exhibit persistent directional moves. Because there is no long or short bias, trend-following is able to capitalize on both bullish and bearish markets. However, if markets are range-bound and directionless, there are no trends to follow, which presents a challenging environment for trend following strategies, for which the last 12 to 18 months have been difficult. While there have certainly been some strong trends (for example, in global equities which are close to all-time highs), other markets (for example, commodities) have exhibited more mean reverting type of behavior, causing losses for most trend-following strategies during this period.
2. QUANTIFYING THE “TRENDINESS” OF MARKETS
Sustained directional market moves constitute a trend. However, not all trends are created equal; some are almost monotonic, while others take a much less straight path, exhibiting considerable volatility. In an attempt to quantify the “trendiness” at time t for market i we define the Trend Ratio (TR):
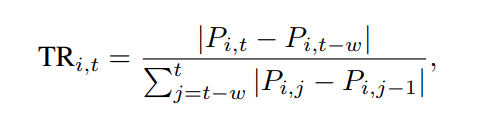
which compares the change in price, P, of the asset over a time period, w, in the numerator, with the degree of daily price variability in the denominator. A stable trend has high values of TR, whereas a noisy, range-bound market has low values. The Trend Ratio can be applied to individual markets or aggregated across markets and sectors. Here, we examine TR at the aggregate level by calculating a simple average, refering to it as the Directional Indicator (DI):
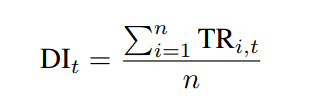
If many markets within the group of n markets are trending, we would expect high values of DI.
Figure 1. Historical values of the Directional Indicator (DI).
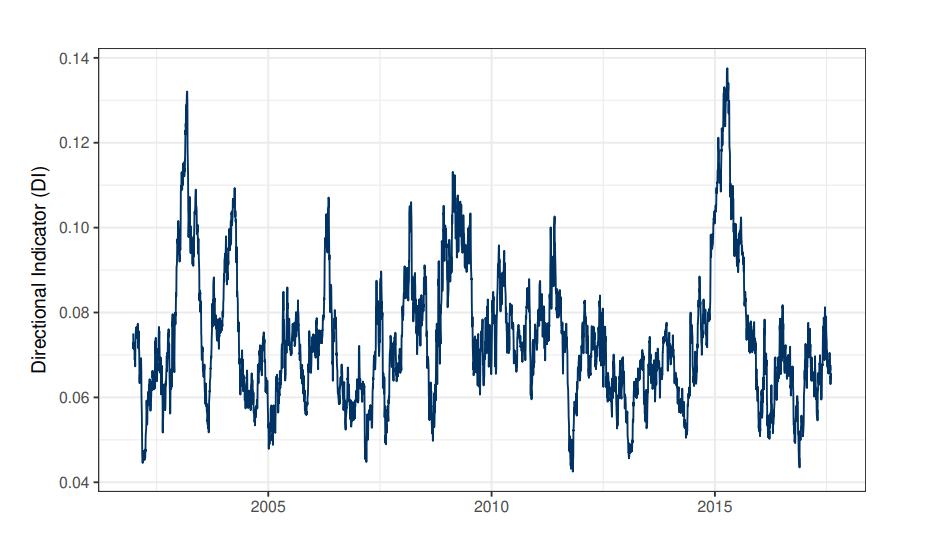
While current values are not remarkably low, they pale compared to 2014-2015, a tremendously successful period for trend-following. Elevated values were also observed in 2008.
We calculate DI for the 55 markets traded in the Graham Tactical Trend strategy, using a lookback period w = 1 year. The results are plotted in Figure 1, which shows the evolution of DI over time. For example, we see elevated values of DI towards the end of 2014, which was a period characterized by dramatic and sustained trends in many macro markets (WTI Crude futures, for example, halved in value over the course of 2014). Interestingly, while DI exhibited elevated levels during the 2008 financial crisis, this was not as dramatic as in 2014. Even though price changes were significant in 2008, they were also accompanied by significant volatility, attenuating the impact of price change on DI. In contrast, the 2011 through 2013 market environment demonstrated low values of DI, and was a markedly challenging period for trend-following.
Figure 2 illustrates the strong positive relationship between the Directional Indicator and trend-following performance (using the SG CTA Trend Sub-Index as a benchmark for the latter), supporting DI as a measure of trendiness.
Figure 2.
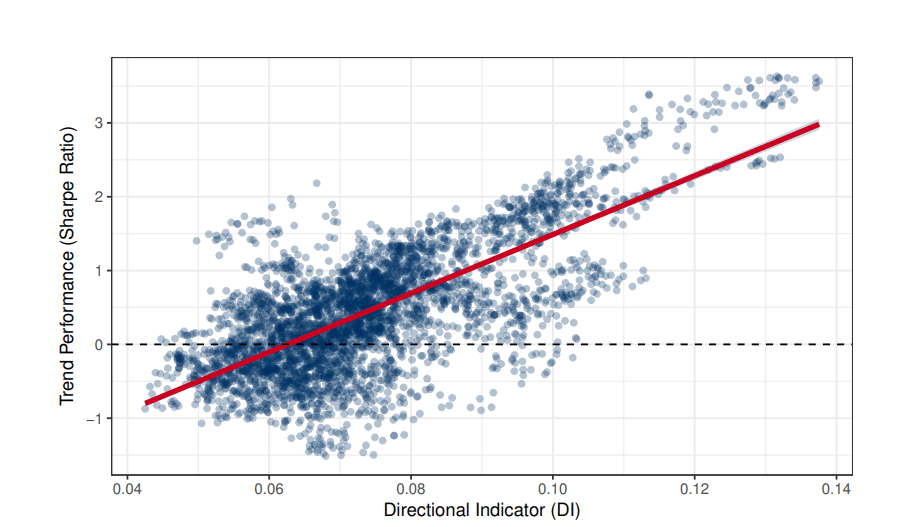
Comparing the Directional Indicator (DI) with CTA performance (SG CTA Trend Sub-Index), we see a strong positive relationship, as indicated by the line of best fit in red. The data covers the years 2002 to 2017.
3. TRENDINESS OF THE RECENT MARKET ENVIRONMENT
When decomposing the Directional Indicator by sector, see Figure 3, the results become particularly illuminating for recent years. In 2014, we see high values for DI across all major sectors, reflecting the breadth of trending markets. In contrast, the last two years have only seen strong trends in one sector each year: fixed income in 2016 and equities in 2017. With equity prices at record highs, and many measures of volatility near record lows, the market has entered an unusual regime in historical context. Through July, the S&P 500 has not had a down month since October 2016 – the longest winning streak in more than 20 years) – and it has been more than a year since the last 5% correction (the longest streak in 22 years). The 2017 trend in equities stands out in both its strength and also its peerlessness in terms of other trending asset classes. Even in 2013, a year characterized by dramatic gains in equities, we did not see such idiosyncratic behavior.
Figure 3.
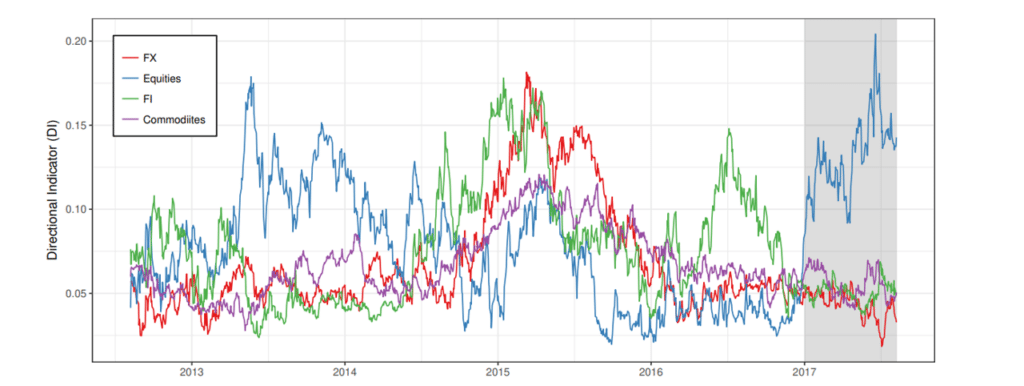
The last 5 years of the Directional Indicator (DI) by sector. In 2017 only equities exhibited persistent directional moves, with other sectors showing little or no directionality. Contrast this to 2014, where all sectors participated. The divergence in the level of DI for equities compared to other sectors is significant.
4. CONCLUSION AND IMPLICATIONS FOR AN INVESTMENT PORTFOLIO
Trend-following strategies seek to identify trends in dozens of global markets, including equities, fixed income, currencies and commodities and exhibit zero correlation to traditional investments such as equities and bonds. While trends arise over time, they do not exist in all markets at all times. Market diversification is therefore essential to improving the potential risk-adjusted returns from trend-following.
We used a simple measure of market trendiness to put recent trend-following performance in perspective. Similarly, to how equities perform poorly in a recession, and bonds perform poorly in a high-rate environment, directionless markets are challenging for trend following.
Post-2015 there have been relatively few exploitable trends. One significant exception is the move in equities in 2017, characterized by significant price appreciation coupled with low volatility; however, this only represents a fraction of the overall investment universe.
LEGAL DISCLAIMER
THIS DOCUMENT IS NOT A PRIVATE OFFERING MEMORANDUM AND DOES NOT CONSTITUTE AN OFFER TO SELL, NOR IS IT A SOLICITATION OF AN OFFER TO BUY, ANY SECURITY. THE VIEWS EXPRESSED HEREIN ARE EXCLUSIVELY THOSE OF THE AUTHORS AND DO NOT NECESSARILY REPRESENT THE VIEWS OF GRAHAM CAPITAL MANAGEMENT. THE INFORMATION CONTAINED HEREIN IS NOT INTENDED TO PROVIDE ACCOUNTING, LEGAL, OR TAX ADVICE AND SHOULD NOT BE RELIED ON FOR INVESTMENT DECISION MAKING.
