Once in a Generation Market Events
The last few years have been marked by several “once in a generation” events. In 2020 we experienced a global pandemic of a severity not seen since the Spanish influenza of 1918. Then, we had the largest ever combined fiscal plus monetary impulse that catapulted asset prices to extreme valuations. Finally came 2022, when we saw war in Eastern Europe and the most rapid increase in inflation in four decades.
Clearly not all these events are equal. From a humanitarian standpoint, the pandemic and the war were catastrophic. From a financial standpoint, inflation is the worst possible shock to an economy that had become completely accustomed to the extraordinary central bank accommodation that had been put in place the decade after the Global Financial Crisis of 2008. Inflation, as we said many times, represented a shock that had to be met by another shock (tighter policy), and the party ended. In other words, whereas the Fed had been able to meet downside shocks to growth with more accommodative policy in the low inflation regime of the previous decade, it no longer has this same luxury in the current high inflation regime and, quite the opposite, has been actively trying to tighten financial conditions.
Markets Decline Following Fed Hiking Cycles
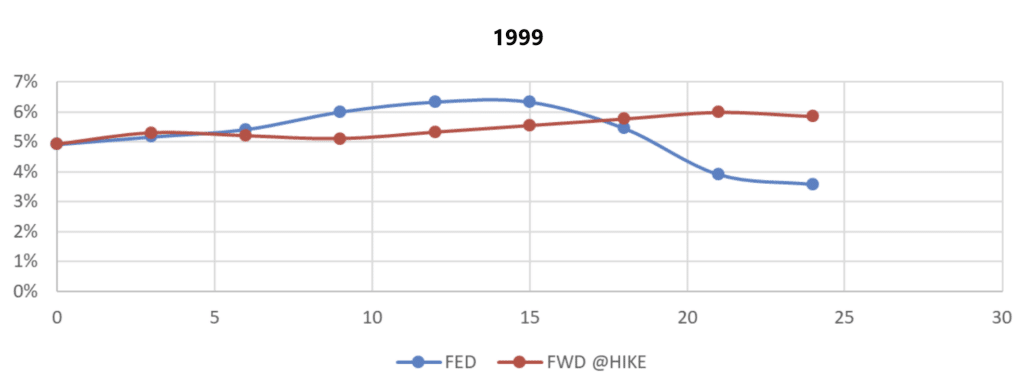
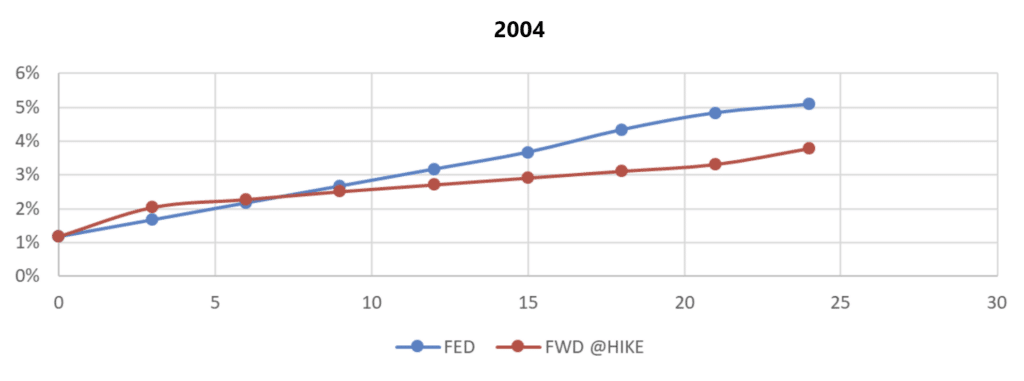
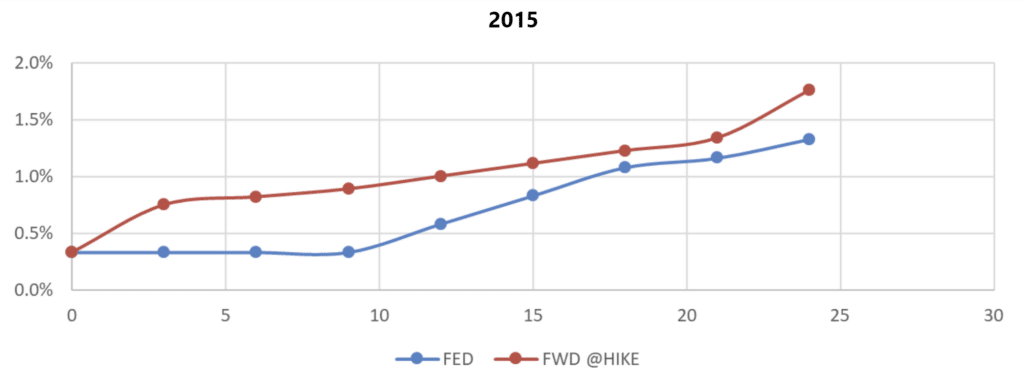
Since Volcker, we have gone through five more hiking cycles.1 Almost all cycles triggered some form of negative market outcome, even though they were not as aggressive as the 2022 cycle. The 1994 cycle was followed by the Mexican and then the Asian crisis. The 1999 cycle was followed by the Nasdaq meltdown in 2000-2001. The 2004 cycle, when the Fed kept rates high until 2007, was followed by the Global Financial Crisis in 2008. Maybe only the 2015 cycle, the least aggressive of all tightening efforts, was uneventful.
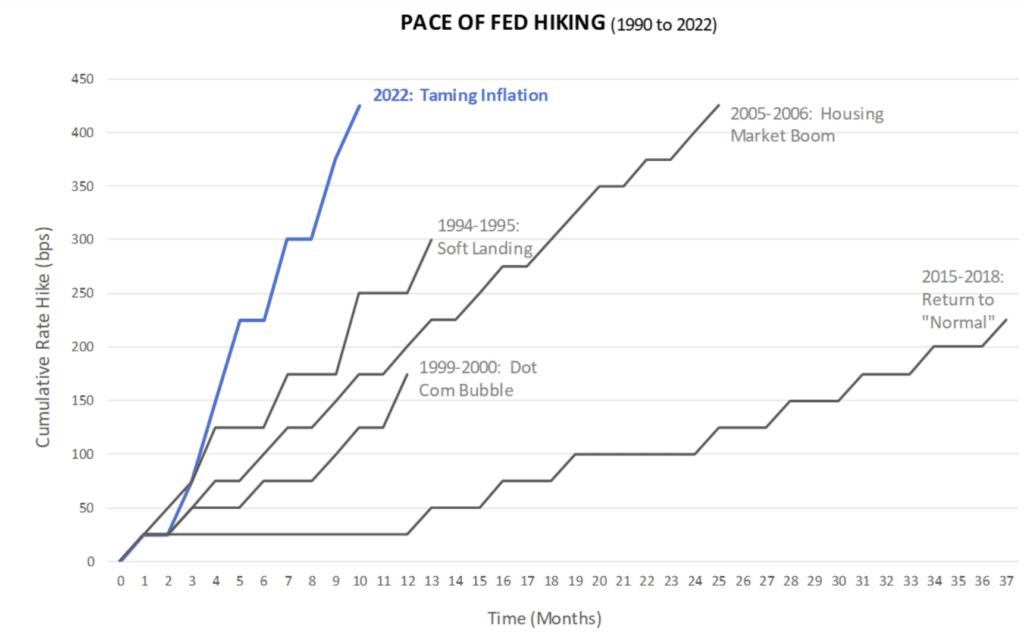
Most Aggressive Fed Hiking Pace in Decades
There are some salient points about the 2022 cycle:
- The Fed has increased its target rate by 425bps in the course of nine months, and is not done hiking. It is likely that when done, Fed Funds will settle 500bps higher than the March 2022 level, and this would have all happened in about one year.
- Previous peak Fed Fund increases are 300bps for the 1994 cycle, 175bps for the 1999 cycle, 425bps for the 2007 cycle and 225bps for the 2015 cycle. Since 1990, a tightening of this magnitude has occurred only once (from June 2004 to June 2006), and in that case it took two years to do so. In this context, 525bps in one year is massive. It represents almost double the average peak hike in half the average period!
How are Markets Pricing in these Rate Hikes?
Not surprisingly, we have seen some record-breaking (negative) statistics in asset markets for 2022. In particular, both stocks and bonds were down significantly and one has to go back to 1937 to find a worse year for the 60/40 portfolio!
Coming back to the Fed, we have seen that this cycle is unprecedented in terms of magnitude and speed. However, there is another aspect that I think is particularly relevant when comparing previous tightening cycles: what markets were pricing at the outset of each cycle. To an extent, market participants have a discounting mechanism in that they try to predict what’s coming. Arguably, if markets are expecting several forthcoming hikes, they should be much more resilient. Vice-versa, if markets have very few hikes priced, they should be more vulnerable. This exercise can also show how well the Fed did in leading the markets into a hiking cycle and, conversely, how well markets forecasted future Fed actions (outside of a small term-premia correction).
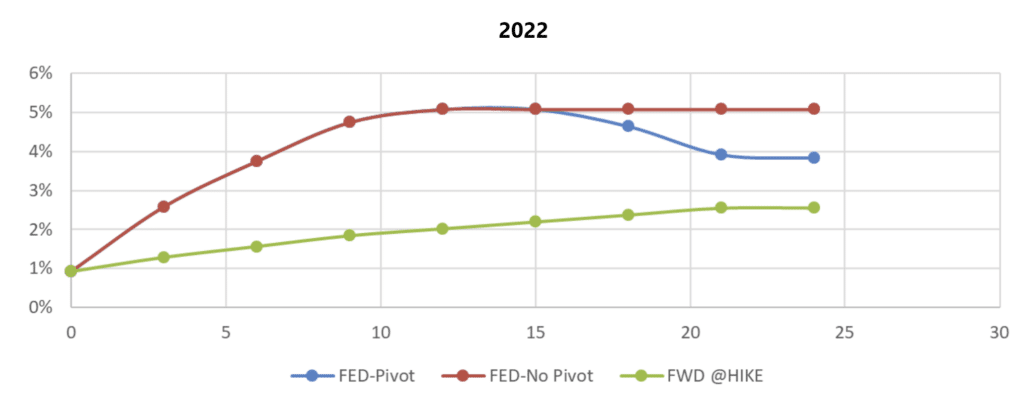
For each hiking cycle, the following chart plots the difference between the actual Fed Funds rate and the forward rates prevailing at the beginning of the hiking cycle (the appendix shows each cycle individually). For 2022, since the cycle is ongoing, we need to project a path for Fed Funds. I work with two scenarios:
- The Fed reaches peak upper rate of 5.25% and stays there (like in 2004-2007)
- After peaking at 5.25%, the Fed cuts along the projections set in the December 2022 Summary of Economic Projections:
FED VS MARKETS
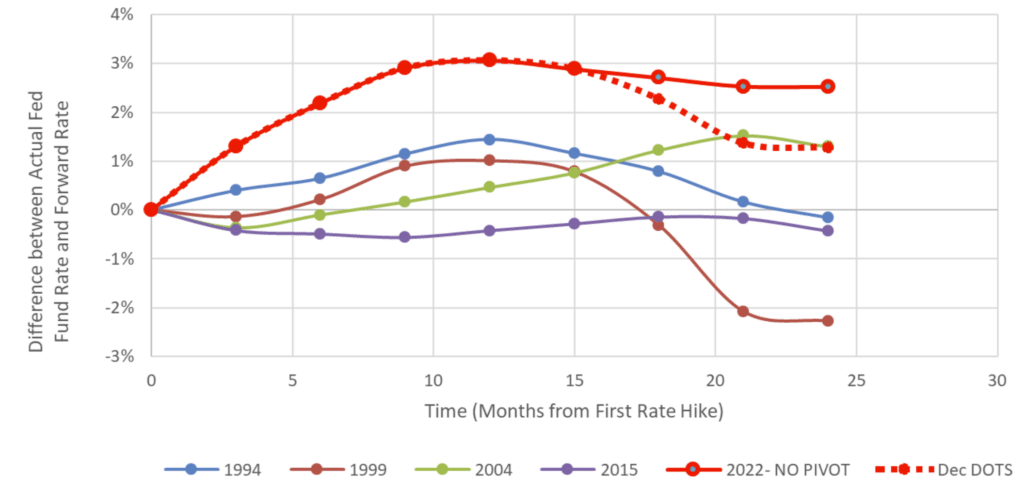
There are many interesting dynamics in this chart:
- First and most important is that 2022 will be the most hawkish hiking cycle by many degrees, in particular when compared to what was priced at the outset. If the Fed intended not to surprise markets, they have failed at it. Put differently, the degree and the magnitude that the market was caught off-guard vis-à-vis what was priced-in was unprecedented.
- Even if the Fed were to start cutting rates at the beginning of 2024, as hinted in the December 2022 interest rate projections, they will still have significantly overdelivered relative to what was expected at the outset of the tightening cycle.
- By contrast, we can see that the Fed started by overdelivering in the 1994 and 1999 cycles, but two years after the hiking cycle began, the Fed funds rate was below what markets had been expecting at the outset. This dynamic suggests that even though the Fed was hawkish to start, they eventually reversed course.
- Interestingly, the 2004 cycle is long and ends up “surprising” markets with Fed funds higher than the forward rates even after two years. It does not necessarily imply that this triggered the Global Financial Crisis of 2008, but it is interesting to note, especially as this is the cycle that seems to be most closely mirroring the current one in terms of Fed over-delivery.
What to expect in 2023?
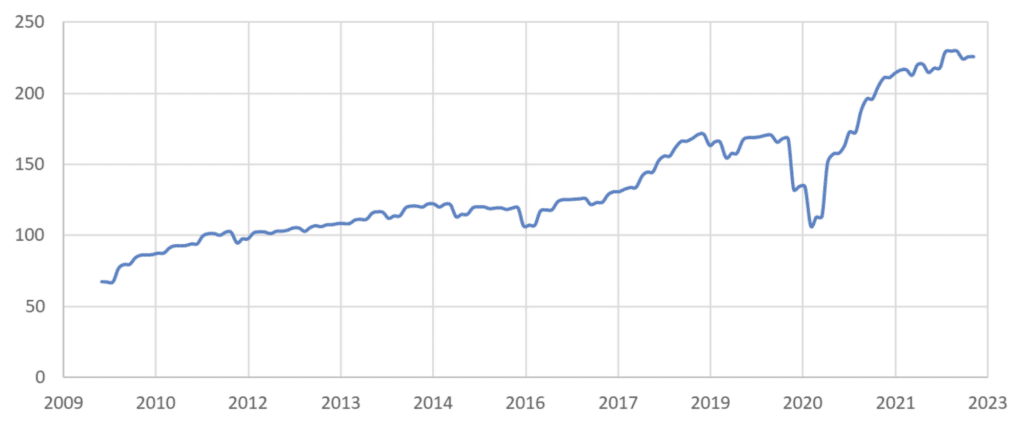
A well-known fact of financial markets is that volatility is persistent (this is what GARCH models are all about – analyzing regime changes in market volatility, which tend to become more volatile during periods of financial crises or world events and less volatile during periods of calm and steady economic growth). The kind of shocks that we saw in 2022 are expected to have long lasting effects. The economy, and more importantly financial markets, will take time to settle after such seismic shocks. At the forefront it is still inflation and not only how fast will it come down, but whether it will rebound like it did in the 70s/80s episode. The outlook for corporate earnings is another notable issue. We mostly think about QE and low rates having pushed up equities through the PE channel. However, as the following graph shows, corporate profits exploded during the last decade. Part of the increase can be attributed to tax changes and inflation, but the largest part of the increase is unexplained.2
SPX EARNINGS PER SHARE
To sum it all up, we are in the middle of an unprecedented tightening of monetary policy. Furthermore, markets went into this cycle completely unprepared and mispriced for what was to come. Whether that is the Fed’s fault or market failure is best saved for another write up, but the consequence is the same: a massive tightening of policy both in absolute terms and also relative to expectations. The Fed rhetoric has also changed considerably. For example, we learned from the December 2022 minutes that the Fed is concerned about an unwarranted ease in financial conditions. Contrast this with the previous decade, when the Fed’s main objective was to avoid at all costs an unwarranted tightening of financial conditions.
The key takeaway for me is that we have a very long and volatile road in front of us, and as such it is critical to keep a close eye on the data but also to be tactical and open minded when thinking about market outcomes.
1 We leave aside the 80’s as the macro imbalances were huge in comparison to the decade after. Clearly there is a lot to learn from the 80’s but when comparing cycles I believe it is best to just focus on the more “modern” post-1980 period.
2 Source: Smolyansky, Michael (2022). “The coming long-run slowdown in corporate profit growth and stock returns,” FEDS Notes. Washington: Board of Governors of the Federal Reserve System, September 06, 2022, https://doi.org/10.17016/2380-7172.3167
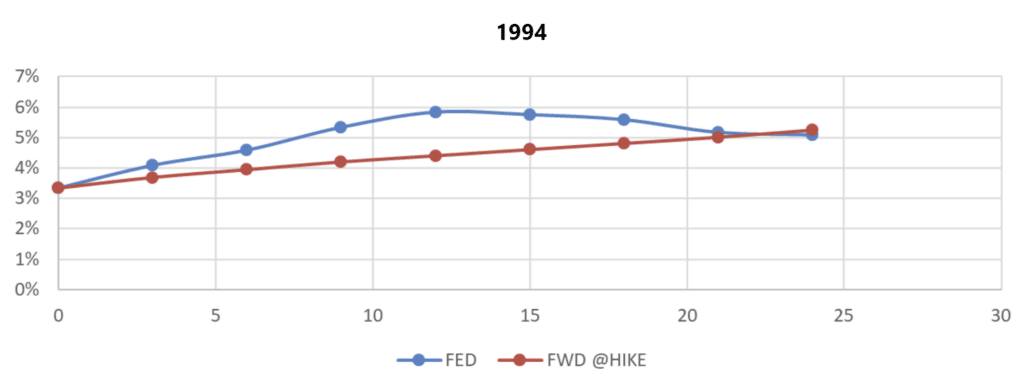
APPENDIX
Comparison between the forward curve at the outset of each tightening cycle and what the Fed delivered ex-post:
DISCLOSURE
This presentation includes statements that may constitute forward-looking statements. These statements may be identified by words such as “expects,” “looks forward to,” “anticipates,” “intends,” “plans,” “believes,” “seeks,” “estimates,” “will,” “project” or words of similar meaning. In addition, our representatives may from time to time make oral forward-looking statements. Such statements are based on the current expectations and certain assumptions of Graham Capital Management’s (“GCM”) management, and are, therefore, subject to certain risks and uncertainties. A variety of factors, many of which are beyond GCM’s control, affect the operations, performance, business strategy and results of the accounts that it manages and could cause the actual results, performance or achievements of such accounts to be materially different from any future results, performance or achievements that may be expressed or implied by such forward-looking statements or anticipated on the basis of historical trends.
This document is not a private offering memorandum and does not constitute an offer to sell, nor is it a solicitation of an offer to buy, any security. The views expressed herein are exclusively those of the authors and do not necessarily represent the views of Graham Capital Management. The information contained herein is not intended to provide accounting, legal, or tax advice and should not be relied on for investment decision making.
Tables, charts and commentary contained in this document have been prepared on a best efforts basis by Graham using sources it believes to be reliable although it does not guarantee the accuracy of the information on account of possible errors or omissions in the constituent data or calculations. No part of this document may be divulged to any other person, distributed, resold and/or reproduced without the prior written permission of GCM.